
Scene Preview
study:
Cortical-subcortical functional networks
SCENE FILE:
ColeAnticevicNetworkPartition_MainFigures
SCENE:
Figure 8
DESCRIPTION:
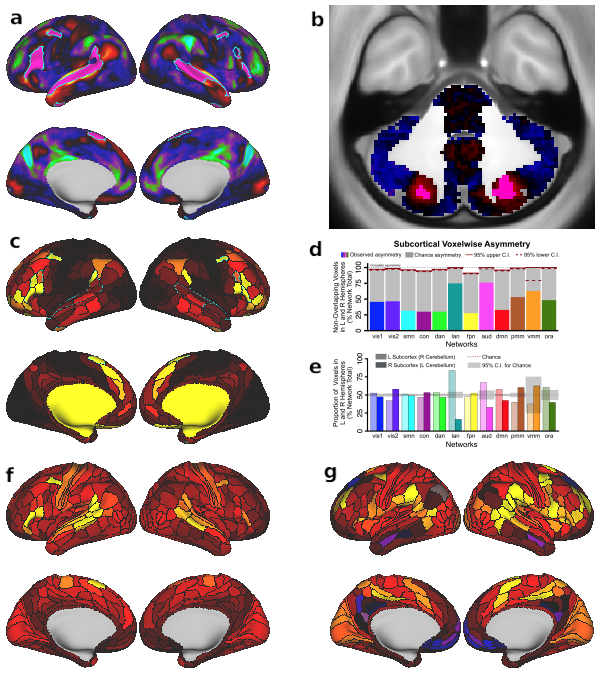
Fig. 8. Language network evaluation. A & B) Overlap between the language network (LAN, teal outline) from our resting-state based network partition and activations from an independent language processing task (collected in the same sample of 337 subjects) in cortical and subcortical regions. Pink areas indicate overlap between LAN and task activation. Underlay shows task activation t-statistics from the ‘Story versus Baseline’ contrast of the LANGUAGE task, replicating the analysis conducted by Glasser et al. (2016). Note that t-scores are shown here because the high statistics resulted in infinity values when converting to Z-scores. Percentage overlap between LAN and task activation in the language processing task is much greater than would be expected by chance. C) Cortical map displaying the asymmetry of parcels. The teal outline indicates the language network, which is highly asymmetric compared to the other networks, with left hemisphere dominance. D & E) Network asymmetry in the subcortex. Colored bars in Panel E show the proportion of subcortical voxels in each network that do not overlap when comparing left and right hemispheres. Complete asymmetry (no overlap) is indicated by dotted line at 100% for reference. gray bars indicate chance asymmetry calculated given the size of each network. Solid and dashed red lines indicate 95% upper and lower confidence intervals for chance respectively. Panel E displays the proportion of total voxels in left and right hemispheres for each network. Chance level for this measure is 50% for all networks; confidence intervals are calculated given the total number of voxels in each network. Because functional representation of left and right is reversed in the cerebellum relative to the rest of the brain (due to the midline crossing of projecting fibers (van Baarsen et al., 2016)), left and right cerebellar hemispheres were exchanged in calculating this measure. Like the cortical networks, panel E&F show that subcortical networks are symmetric in general, with a left lateralized LAN. In subcortex, VMM is also significantly asymmetric. F & G) Functional connectivity seed maps for left and right perisylvian language areas (PSL) based on resting-state data in 337 subjects. Both the left and right language seed area show strongest connections to ipsilateral regions.
TAGS:
Surface Mesh:32k fs LR, Modality:T1-weighted, Other Data:gene, Species:Human