
Scene Preview
SCENE FILE:
HCP-Development
SCENE:
Figure 8
DESCRIPTION:
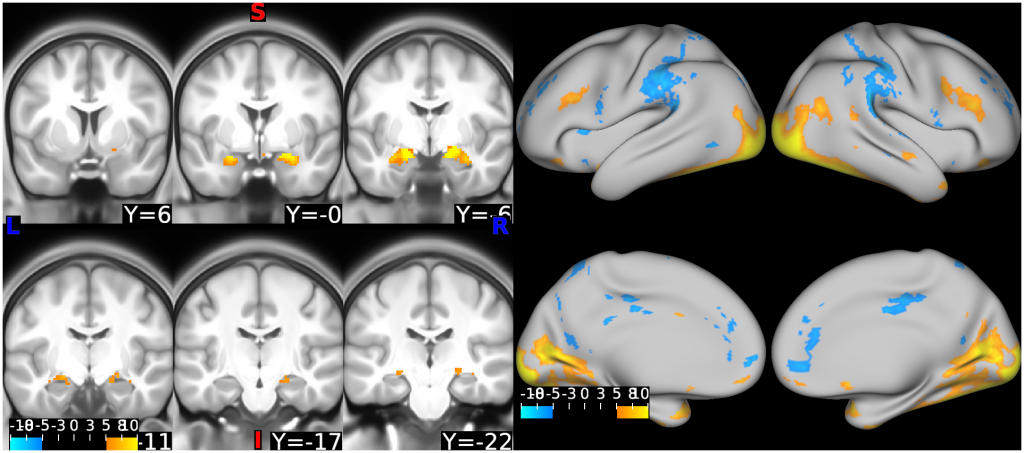
Figure 8. Group activation maps for the primary contrast in the Emotion task in an early sample of HCP-D participants (N=105). Positive activations (hot colors) depict Faces > Shapes activity, negative activations (cool colors) depict Shapes > Faces activity. Analysis was grayordinate-based, so activation in the volume view on the left is restricted to subcortical structures. Image threshold Z > 5.01, which corresponds to p < 0.05, Bonferroni-corrected across grayordinates. Coronal images in neurological convention (R = R). Numbers on left denote y-slice coordinates (mm) in MNI152 space. L = left, R = right.
TAGS:
Surface Mesh:32k fs LR, Registration:MSMAll, Modality:T1-weighted, Species:Human