
Scene Preview
Data Use Terms
You have not yet agreed to all data access terms. Please read through the terms marked × and register agreement in order to access data.
× dHCP Open Access Data – Terms of use (Version 4.0; 2019.05.23)
The Consortium of King’s College London, Imperial College London, and University of Oxford (KCL-ICL-OX dHCP Consortium) has collected data from human subjects (data subjects) under the Developing Human Connectome Project. I understand that the KCL-ICL-OX dHCP Consortium will release Open Access dHCP Data, i.e. data which have an extremely low potential for identification of data subjects (see #5 below) after an individual researcher has agreed to these Open Access dHCP Data – Terms of Use (this agreement).
I request access to Open Access dHCP Data for scientific and/or medical research purposes (research), and I agree to the following terms:
1. I declare that I am employed by, or a student of, a for-profit or a not-for-profit organisation that participates in research for the advancement of science and medicine and I will use dHCP data responsibly and only for research that enables the advancement of science and medicine. I understand that I may only use the results of my research for public engagement activity if I comply with paragraphs 12 and 13.
2. I understand that I am not permitted, and I will not use dHCP data for any Commercial Purpose.; use of dHCP data for research by a for-profit organisation shall not be considered a Commercial Purpose per se, unless any of the conditions of paragraph 3 are met.
3. The expression ‘Commercial Purpose’ means the direct commercialisation of dHCP data or the indirect commercial exploitation of dHCP data, and expressly includes the use of dHCP data (i) to provide a service in exchange for money, goods or other valuable benefit (ii) to produce or manufacture products for sale, (iii) in any activity that results in any sale, lease, license, or transfer of dHCP data, for example through a licensing, marketing or sales transaction
4. In this agreement (i) the expression OA-dHCP data means Open Access dHCP Data supplied by KCL-ICL-OX dHCP Consortium and (ii) the expression dHCP data includes OA-dHCP data and any copies or modifications of OA-dHCP data and any material that incorporates, embeds or otherwise contains OA-dHCP data.
5. I understand that OA-dHCP data consists of MRI brain imaging data and non-sensitive data (age at birth, age at scan, gender, birth weight, head circumference and radiology score) which have been obtained from data subjects. In order to protect data subjects, these data have been pseudonymised and subjected to post-collection processing (data processing) to remove any data elements that could (with suitable technology) otherwise be reconstructed and/or processed to reveal facial features of the data subjects. If I receive any OA-dHCP data, in error, that have not been subjected to the data processing I will:
- immediately notify‡ the KCL-ICL-OX dHCP Consortium, and;
- not use such OA-dHCP data for any purpose, and;
- destroy such OA-dHCP data after notification to the KCL-ICL-OX dHCP Consortium, or if specifically requested by a member of the dHCP team or an administrator from the KCL-ICL-OX dHCP Consortium (representative), return such OA-dHCP data to the KCL-ICL-OX dHCP Consortium, in accordance with instructions from the representative and;
- not take any action that might jeopardise the privacy and/or lead to identification of any data subjects.
6. I will promptly notify‡ the KCL-ICL-OX dHCP Consortium (a) if dHCP data have been accidentally lost or stolen or (b) if dHCP data have been accessed by another person, and (c) of any change in my contact details; in the event that I do not promptly notify the KCL-ICL-OX dHCP Consortium of any change in my contact details, this agreement and my rights to use dHCP data will automatically terminate and I will not benefit from the exception at paragraph 18.
7. I understand that OA-dHCP data are experimental and may contain errors (including errors and/or omissions in data processing), and I accept that they are provided on an “as is” basis and without any warranty (a) of accuracy, completeness, or fitness for any purpose or (b) that their use will not infringe the rights of any third party. Any representations or warranties given by any representative relating to OA-dHCP data, either expressed or implied, are excluded to the maximum extent permitted by law. Except to the extent prohibited by law, the KCL-ICL-OX dHCP Consortium accepts no liability for any kind of damages or loss arising in any way from my use of dHCP data or from making OA-dHCP data available to me, however caused including without limitation, economic damages.
8. I will comply with all applicable legislation and with all relevant rules and regulations concerning data protection, information governance and ethical research. If required, I will ensure I have ethical approval in place to use dHCP data for the research from the relevant committee or office that oversees research on human subjects e.g. Research Ethics Committee, Institutional Review Board or similar.
9. I understand that OA-dHCP data are being made available to me on the understanding that they are only for use by me and co-workers at the same institution who have also signed this agreement in their own right. I will keep dHCP data strictly confidential and, except as provided for at paragraph 13, will not publish, share or redistribute dHCP data and will refer any requests (including requests from my supervisors, co-workers or those that I supervise) for access to OA-dHCP data to the KCL-ICL-OX dHCP Consortium.
10. I understand that dHCP data are, and will remain, the property of the KCL-ICL-OX dHCP Consortium and I agree that this agreement does not grant me any ownership rights to the dHCP data nor shall they affect the rights of the KCL-ICL-OX dHCP Consortium to provide OA-dHCP data to others.
11. I will protect dHCP data and prevent unauthorised use and access, by using suitable safeguards (administrative and/or technical and/or physical).
12. In any Publication or public engagement activity reporting the results of the research, I will only include images compiled from dHCP data that conform to the specifications set out in paragraph 13.
13. I will only share or redistribute data derived from OA-dHCP data (derived data), when they do not contain or consist of OA-dHCP data, and cannot be reverse-engineered to generate OA-dHCP data, and there is no foreseeable risk of a data subject being identified from the derived data. I will contact the KCL-ICL-OX dHCP Consortium and discuss making any derived data available via the KCL-ICL-OX dHCP Consortium if the derived data do not meet the specifications for sharing or redistribution, as set out in this paragraph.
14. I will adequately cite & acknowledge the constituent institutions of the KCL-ICL-OX dHCP Consortium, and funding of the Developing Human Connectome Project by the European Research Council when making any kind of public communication of results (abstracts, papers, posters, book chapters, oral presentations, digital media etc.) obtained using dHCP data or resources (Publication). All printed and digital Publications derived from dHCP data shall contain the following wording in the acknowledgments section: “Acknowledgement: These results were obtained using data made available from the Developing Human Connectome Project funded by the European Research Council under the European Union’s Seventh Framework Programme (FP/2007-2013) / ERC Grant Agreement no. [319456]”.
15. When making any Publication I agree to cite relevant publications describing the methods used by the KCL-ICL-OX dHCP Consortium to acquire and process the data. Appropriate citations in any Publication will depend on the type and use of dHCP data. An annotated and up-to-date list of KCL-ICL-OX dHCP Consortium publications for consideration is available at http://www.developingconnectome.org/dhcp-publications/
16. I agree to provide authorship to appropriate KCL-ICL-OX dHCP Consortium researchers if they have made an academic contribution to the Publication, and in such case I will provide a pre-submission copy of the Publication for the authors to approve/comment on prior to submission. I understand that authorship is not required by KCL-ICL-OX dHCP Consortium researchers where their sole contribution is providing OA-dHCP data.
17. I understand that if I fail to comply with the terms and conditions of this agreement my privileges to access dHCP data will be immediately terminated. If my non-compliance relates to the privacy of data subjects I understand that any, or all, of the constituent institutions that make up the KCL-ICL-OX dHCP Consortium may take further action against me, including criminal proceedings and/or legal action and/or reporting my non-compliance to my employer(s) and/or any organisation that registers and/or places sanctions on persons who have failed to comply with obligations relating to privacy of data subjects.
18. I understand that KCL-ICL-OX dHCP Consortium may at any time (a) give 30 days notice to terminate or vary my rights to use dHCP data, or (b) terminate my rights to use dHCP data upon immediate notice in the event of privacy concerns for the data subjects. Upon termination of this agreement I will immediately cease using dHCP data except for the limited purpose of validating, justifying or responding to queries about analyses (exception) undertaken during the period of this agreement, and I will provide written confirmation‡ of destruction to the KCL-ICL-OX dHCP Consortium. I understand that the exception does not apply where termination is due to my failure to comply with this agreement. My obligations under paragraphs 2, 6, 9 and 11 of this agreement will survive until I have provided written confirmation of destruction of dHCP data. Termination of this agreement shall not affect the survival of any terms and conditions which by their nature are intended to continue after termination, and for avoidance of doubt includes those set out at paragraphs 2, 7 and 10.
Files
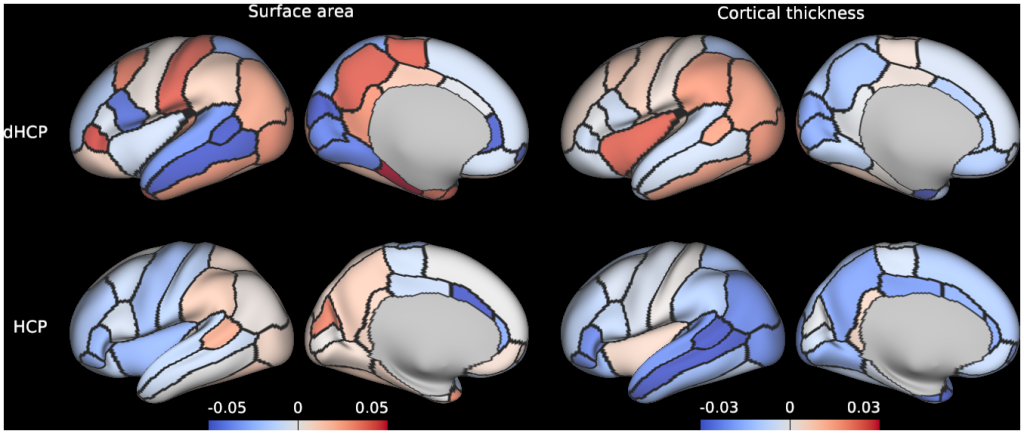
Scene: Figure S1:Region-of-interest asymmetry indices of surface area and cortical thickness for dHCP and HCP-YA.
study:
Structural and functional asymmetry of the neonatal cerebral cortex
SCENE FILE:
Williams_dHCPCorticalAsymmetry
SCENE:
Figure S1:Region-of-interest asymmetry indices of surface area and cortical thickness for dHCP and HCP-YA.
DESCRIPTION:
Asymmetry indices of surface area and cortical thickness for dHCP and HCP-YA, summarised using the M-CRIB-S atlas (for dHCP; neonatal equivalent of Desikan-Killiany atlas) and the Desikan-Killiany atlas (for HCP-YA). Leftward asymmetry indices are color-coded red, and rightward asymmetry indices are color-coded blue.
TAGS: