You have not yet agreed to all data access terms. Please read through the terms marked × and register agreement in order to access data.
× WU-Minn HCP Consortium Open Access Data Use Terms
I request access to data collected by the Washington University - University of Minnesota Consortium of the Human Connectome Project (WU-Minn HCP), and I agree to the following:
1. I will not attempt to establish the identity of or attempt to contact any of the included human subjects.
2. I understand that under no circumstances will the code that would link these data to Protected Health Information be given to me, nor will any additional information about individual human subjects be released to me under these Open Access Data Use Terms.
3. I will comply with all relevant rules and regulations imposed by my institution. This may mean that I need my research to be approved or declared exempt by a committee that oversees research on human subjects, e.g. my IRB or Ethics Committee. The released HCP data are not considered de-identified, insofar as certain combinations of HCP Restricted Data (available through a separate process) might allow identification of individuals. Different committees operate under different national, state and local laws and may interpret regulations differently, so it is important to ask about this. If needed and upon request, the HCP will provide a certificate stating that you have accepted the HCP Open Access Data Use Terms.
4. I may redistribute original WU-Minn HCP Open Access data and any derived data as long as the data are redistributed under these same Data Use Terms.
5. I will acknowledge the use of WU-Minn HCP data and data derived from WU-Minn HCP data when publicly presenting any results or algorithms that benefitted from their use.
1. Papers, book chapters, books, posters, oral presentations, and all other printed and digital presentations of results derived from HCP data should contain the following wording in the acknowledgments section: "Data were provided [in part] by the Human Connectome Project, WU-Minn Consortium (Principal Investigators: David Van Essen and Kamil Ugurbil; 1U54MH091657) funded by the 16 NIH Institutes and Centers that support the NIH Blueprint for Neuroscience Research; and by the McDonnell Center for Systems Neuroscience at Washington University."
2. Authors of publications or presentations using WU-Minn HCP data should cite relevant publications describing the methods used by the HCP to acquire and process the data. The specific publications that are appropriate to cite in any given study will depend on what HCP data were used and for what purposes. An annotated and appropriately up-to-date list of publications that may warrant consideration is available at http://www.humanconnectome.org/about/acknowledgehcp.html
3. The WU-Minn HCP Consortium as a whole should not be included as an author of publications or presentations if this authorship would be based solely on the use of WU-Minn HCP data.
6. Failure to abide by these guidelines will result in termination of my privileges to access WU-Minn HCP data.
DESCRIPTION:
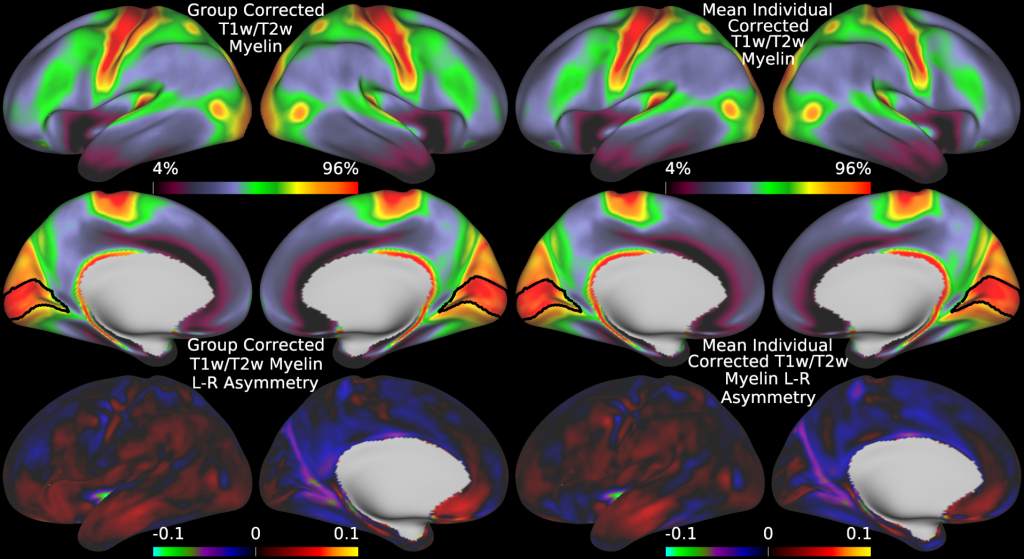
Figure 7 illustrates a comparison between the correction applied to the group average and the mean of the individually corrected myelin maps, showing that they are very similar.