
Scene Preview
Scene: Figure S3. Average delay activity during individual task conditions based on analysis of parcellated data.
study:
Position coding in spatial working memory
SCENE FILE:
BALSA
SCENE:
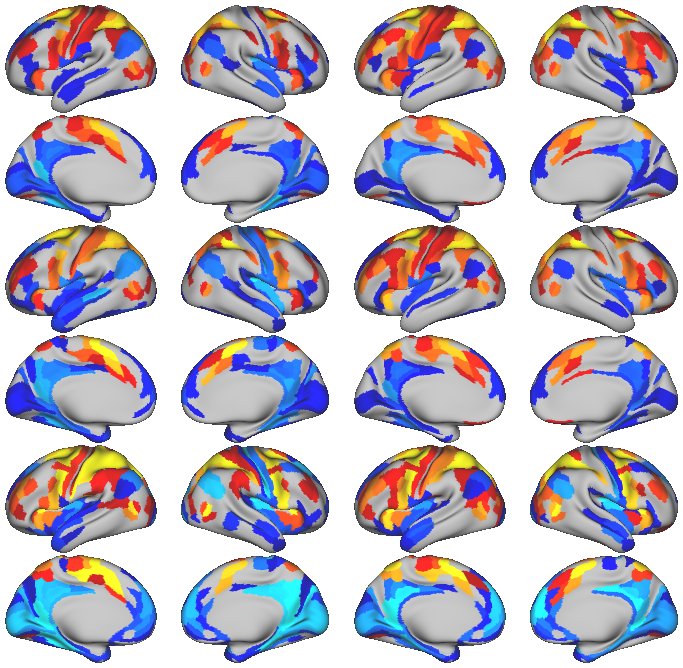
Figure S3. Average delay activity during individual task conditions based on analysis of parcellated data.
DESCRIPTION:
The images show the average delay activity during individual task conditions within specific HCP parcels for both experiments. Results were obtained by a one-sample t-test of the GLM regressor during the delay period, corrected with FDR and thresholded at q
TAGS: