
Scene Preview
Scene: Figure 3
study:
Notes on fiber length measurements
SCENE FILE:
CTL-76
SCENE:
Figure 3
DESCRIPTION:
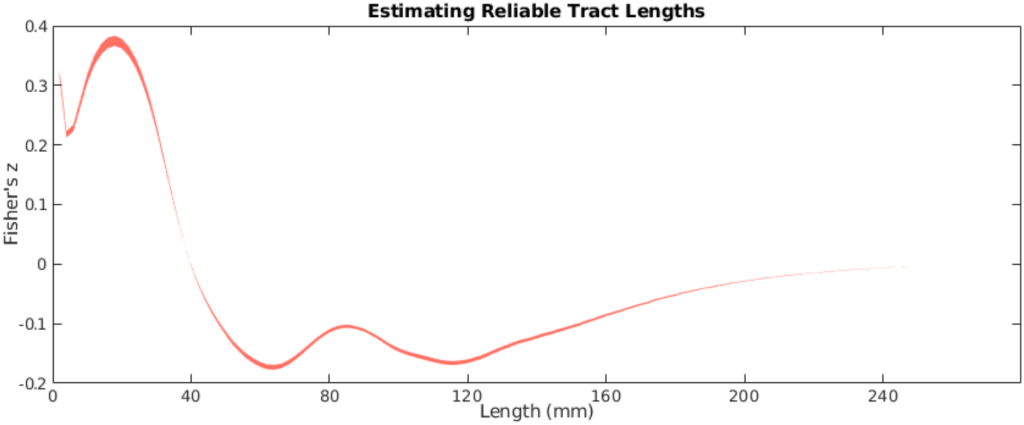
Estimation of reliable tract lengths. Fibers below 40mm in MNI space are primarily driven by cortical folding. The red line shows the correlation between the empirical length maps and the null model length maps with the thickness of the line representing the 95% confidence interval of the mean Fisher's z-score across all participants. Note that the length at which there is a sudden decrease in correlation with the null model is approximately 40mm.
TAGS:
Species:Human, Connectivity:Tractography