
Scene Preview
study:
The Human Connectome Project’s neuroimaging approach
SCENE FILE:
Glasser_et_al_2016_Neuroimaging_HCP_Style_Primer_SI
SCENE:
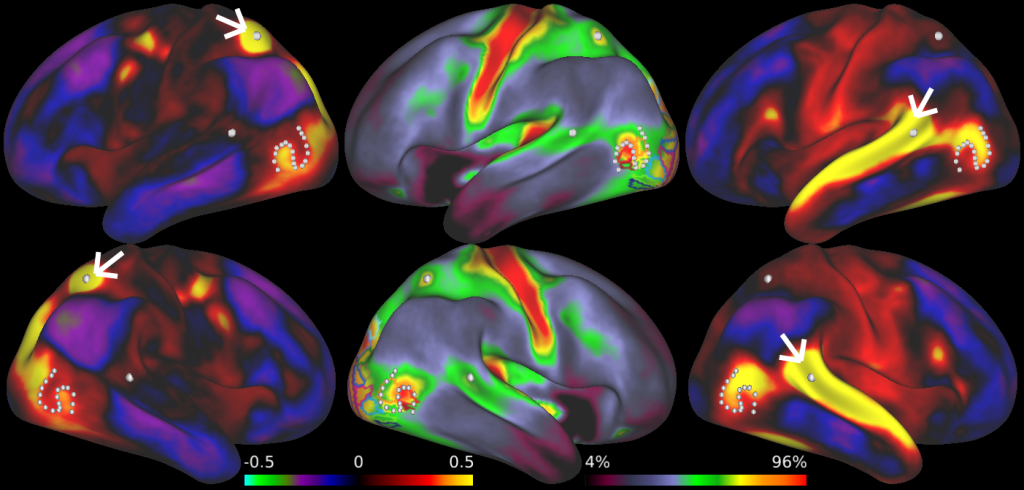
Figure 10
DESCRIPTION:
A comparison between the HCP data and published retinotopic parcellation data. Data from another study and from 120 HCP subjects (from Q1-2) were registered using MSM areal-feature-based registration and group average registration drift was removed from both. Because of this, a contour in functional connectivity in the MT+ region distinguishing strong connectivity to the heavily myelinated IPS hotspot (LIPv, column 1) and to the STS (column 3) lines up with the border between MT+V4t (orange and yellow) and MST+FST (red and maroon, middle column). This illustrates the kind of precise cross-modal, cross-study boundary comparisons possible using the HCP-Style paradigm.
TAGS:
Surface Mesh:32k fs LR, Species:Human, Registration:MSMAll, Modality:T2-weighted, Modality:Myelin Map, Modality:T1-weighted