
Scene Preview
Scene: Supplementary_figure_7
study:
Basis of executive functions
SCENE FILE:
ExecFunc_ms
SCENE:
Supplementary_figure_7
DESCRIPTION:
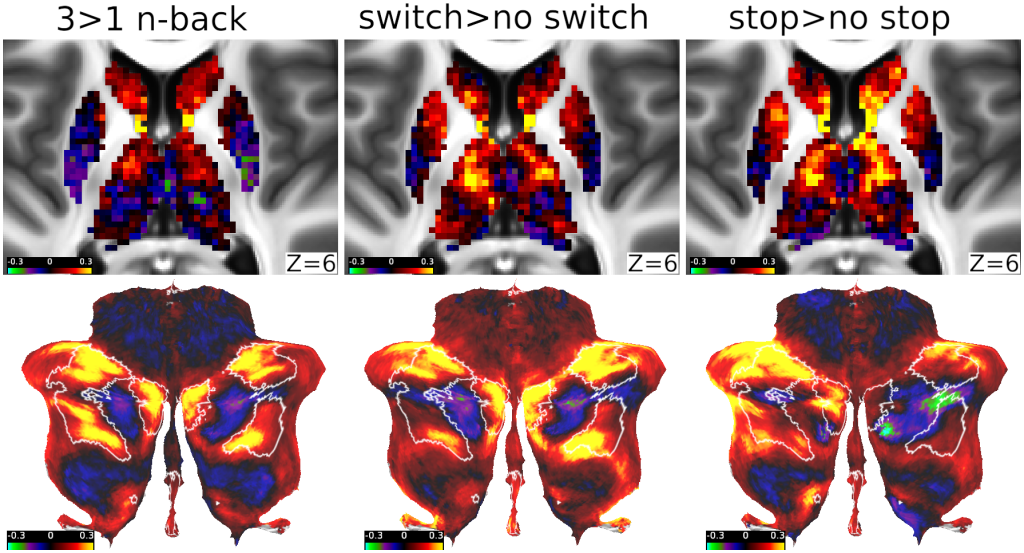
Activations (percent signal change) for each executive contrast in an axial slice of the subcortex (top row) and a flat map of the cerebellum (bottom row). MD areas as defined in (Assem et al. 2020) are surrounded by white borders on the cerebellar surface.
TAGS:
Species:Human, Modality:Task fMRI, Parcellation:HCP_MMP1.0, Modality:T1-weighted, Modality:T2-weighted