
Scene Preview
study:
Cortical DTI and NODDI
SCENE FILE:
DTI_NODDI
SCENE:
Figure 3
DESCRIPTION:
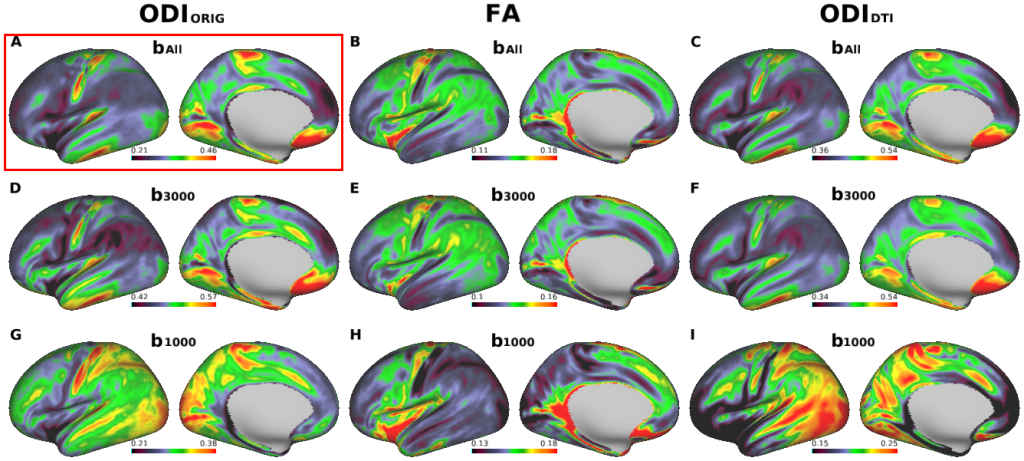
Figure 3. Cross-subject average cortical surface maps of orientation dispersion index (ODI) and fractional anisotropy (FA).
Cortical surfaces are different in terms of computation methods: original NODDI ODI (ODIORIG) (A, D, G), DTI-derived FA (B, E, H) and DTI-derived NODDI ODI (ODIDTI) (C, F, I), each used different b-shell datasets: all three b-values (bAll) vs only those of b=3000 (b3000) and low b-values (b1000), respectively. A reference cortical map of ODI (ODIORIG/bAll) in (A) showed high values in the early sensory areas including somatosensory, auditory, and visual. Note that ODIORIG/b3000, ODIDTI/bAll in (C) and ODIDTI/b3000 in (F) showed similar distribution to the reference. Any computation methods using b1000 (H, I, J) did not show comparable pattern with the reference.
TAGS:
Surface Mesh:32k fs LR, Registration:MSMAll