
Scene Preview
study:
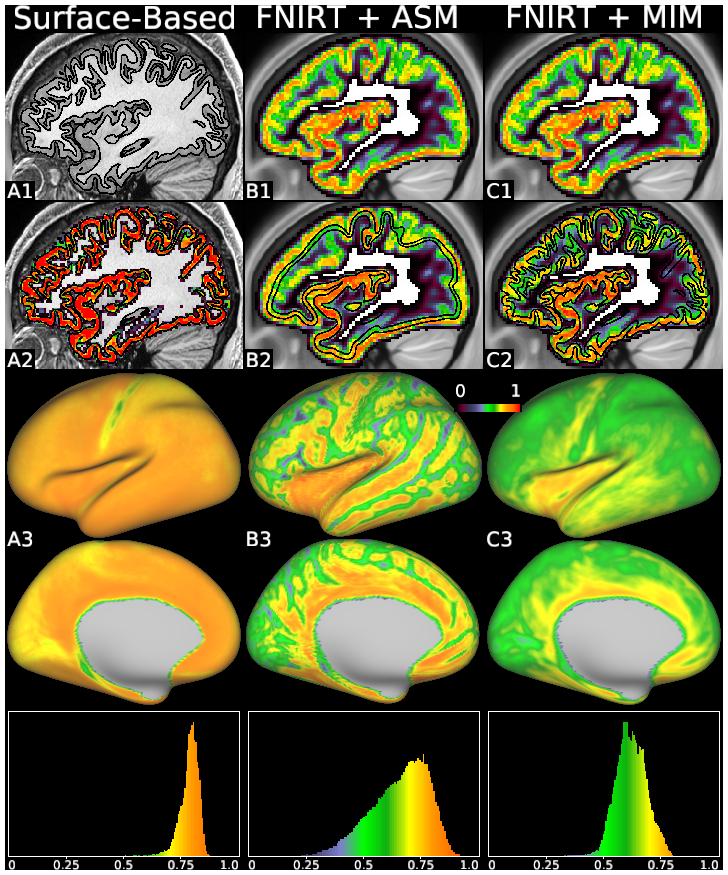
The Impact of Traditional Neuroimaging Methods on the Spatial Localization of Cortical Areas
SCENE FILE:
Coalson_et_al_2018_suppl
SCENE:
Supplemental Figure S9
DESCRIPTION:
surface-based analysis (left column), Average Surface Mapping (ASM, middle column), and Multi-Individual Mapping (MIM, right column). This figure uses the cortical gray matter volume fraction (see Figure 7) from every subject at 2 mm, and illustrates key steps of representative processing and visualization pipelines. The surface pipeline starts by segmenting the individual structural data to generate cortical surfaces (A1, showing HCP subject 121618), then maps the individual’s cortical signal (A2) to the surface (using the ribbon mapping technique, which uses all voxels between the white and pial surfaces), and then averages the surface data across subjects (A3). Volume-based approaches start by attempting to align the cortex with volume warps and averaging the signal across subjects (B1, C1, which are identical), then use either a group average surface (B2) or many individual surfaces (C2, showing HCP subject 121618) to map the group data to the surface, resulting in lower cortical signal fractions and artifactual patterns due to cortical folding variability (B3, C3). Histograms along the bottom show what fraction of the surface-mapped data comes from cortex (rather than from white matter or CSF). Note in Panel B2 that the average surfaces align poorly with the average volume in many regions. Panel A3 shows a clear advantage in uniformity and magnitude when using surface-based methods. See Supplemental Methods Sections M2 and M9.
TAGS:
Surface Mesh:32k fs LR, Registration:MSMAll, Modality:T1-weighted, Other Data:gene