
Scene Preview
Scene: Figure_1
study:
HCP-D T1w/T2w Development
SCENE FILE:
Baum_hcpd_T1wT2w_development
SCENE:
Figure_1
DESCRIPTION:
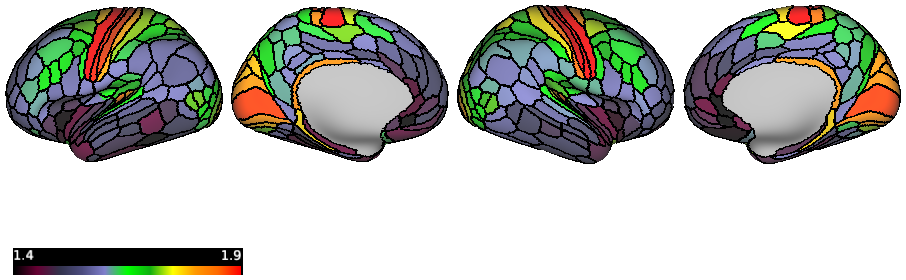
Figure 1.
T1w/T2w maps were parcellated using the HCP multimodal atlas (Glasser et al., 2016a) and averaged across participants. T1w/T2w units are arbitrary, representing relative estimates of intracortical myelin content that are comparable within a consistently acquired study. T1w/T2w units of 1.4 and 1.9 correspond to the 2nd and 98th percentiles in this dataset.
TAGS:
Species:Human, Modality:Myelin Map