
Scene Preview
study:
Similar patterns of cortical expansion during human development and evolution
SCENE FILE:
Hill_PNAS_2010_Devel_EvolutionaryExpansion_Figure_4.wb_scene
SCENE:
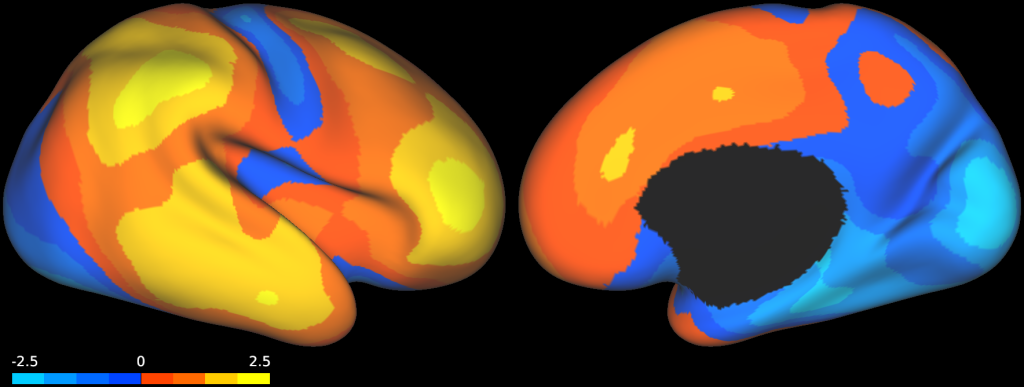
Figure_4A_Evolutionary_Expansion_Map (Relative Expansion)
DESCRIPTION:
Fig. 4. Comparison of evolutionary and postnatal cortical surface expansion.
(A) Map of regional evolutionary cortical expansion between an adult macaque and the average human adult PALS-B12 atlas (right hemisphere only). Evolution expansion scale indicates how many times larger the surface area is in humans relative to the corresponding area in the macaque.
(B) Map of human postnatal cortical expansion (combined left and right hemispheres) for comparison (detailed in Fig. 1 legend). (C) Correlation map comparing postnatal to evolutionary cortical surface expansion.
TAGS:
Species:Human, Species:Macaque