
Scene Preview
Scene: Figure 2
study:
Fiber Length Profiling
SCENE FILE:
CTL-76
SCENE:
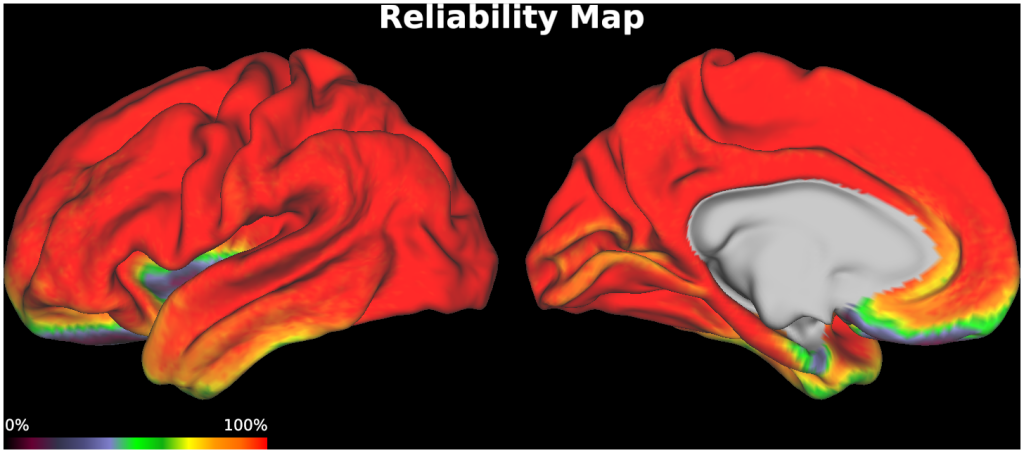
Figure 2
DESCRIPTION:
Reliability Map. Red areas indicate regions where tractography was consistently successful across all individuals while purple, yellow or green regions indicate regions where tractography was unsuccessful in certain individuals.
TAGS:
Species:Human