
Scene Preview
study:
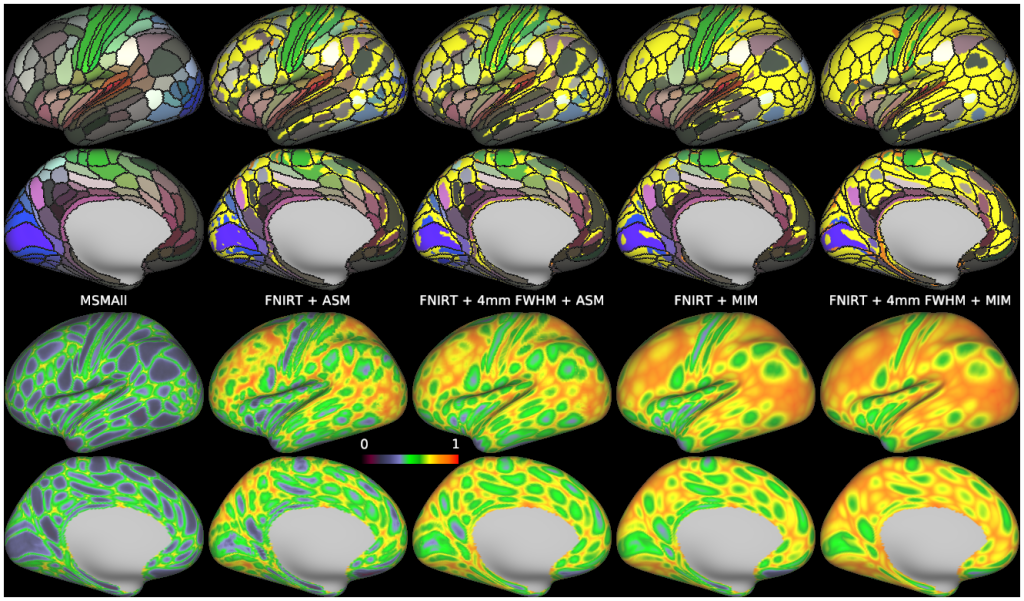
The Impact of Traditional Neuroimaging Methods on the Spatial Localization of Cortical Areas
SCENE FILE:
Coalson_et_al_2018
SCENE:
Figure 9
DESCRIPTION:
Comparison of the surface-based maximum partial-volume map to the maps produced after volume-based analysis with ASM or MIM, and 4-mm FWHM volume-based smoothing before ASM and MIM. The figure uses the same methods as SI Appendix, Fig. S10, and then uses the maximum fraction to label the surface vertices. In the Upper two rows, bright yellow is the white matter label, and bright orange is the CSF label (occurring in only a few small patches). Substantial regions of the cortex are not separated into cortical areas after volume-based analysis and MIM, and ASM shows significant stripes where the gyral crowns are decapitated. On the other hand, in regions of lower folding variability and variability of areas vs. folds, such as the insula, volume-based methods reproduce the parcellation found with the surface-based approach, particularly if smoothing is not used. See SI Appendix, Supplemental Methods M2 and M9.
TAGS:
Surface Mesh:32k fs LR, Registration:MSMAll