
Scene Preview
study:
The Human Connectome Project’s neuroimaging approach
SCENE FILE:
Glasser_et_al_2016_Neuroimaging_HCP_Style_Primer_MainText
SCENE:
Figure 6
DESCRIPTION:
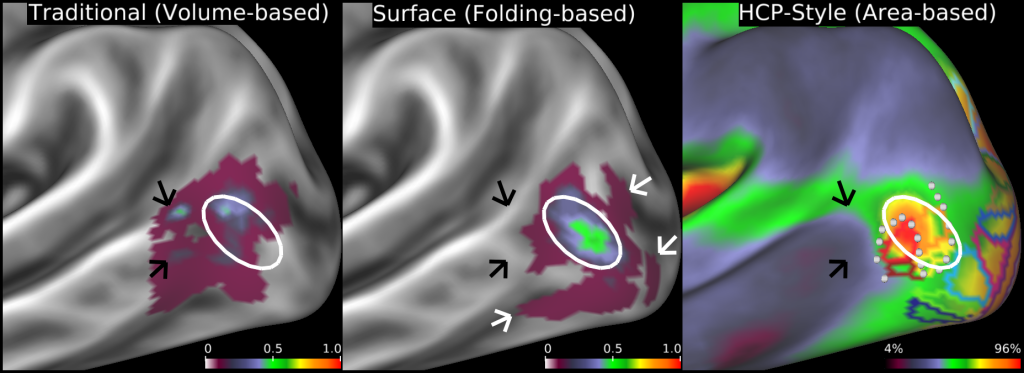
Fidelity of localizing area MT+ (architectonic area hOc5) when mapped to the cortical surface by different methods. Left: volume-based mapping of probabilistic cytoarchitectonic area hOc5 from 10 postmortem subjects mapped to a cortical atlas surface. Black arrows point to locations where the volume-based mapping spreads across gyral and sulcal boundaries. Center: Surface-based registration of hOc5 from the same 10 subjects mapped to individual surface reconstructions, then to a surface-based atlas using FreeSurfer's folding-based surface registration method 78. White arrows identify 'outlier' hOc5 from individual subjects that are not well aligned to the fsaverage group average owing to imperfect correspondence between areal boundaries and sulcal folds. Left and center panels adapted from Van Essen et al., 2012. The white oval is in the same location across all panels showing how the volume-based alignment drifts away from the surface-based alignments, in addition to having substantially lower cross-subject overlap. Right: Group average cortical myelin map (from 196 HCP subjects) with a yellow/orange/red hotspot indicating the MT+ complex and retinotopic areal Maximum Probability Maps (MPMs) (from 12 non-HCP subjects) both registered using areal-feature-based surface registration and 'de-drifted' (see SI #13). As shown in SI Figure 9, the white dots represent a contour along which functional connectivity rapidly changes that aligns with the border between retinotopic areas MT and pMST from a separate study. This is an example of the more conclusive cross-study, cross-modal boundary comparisons made possible by the HCP-style analysis paradigm.
TAGS:
Surface Mesh:32k fs LR, Species:Human, Modality:T2-weighted, Modality:Myelin Map, Registration:MSMAll, Modality:T1-weighted