
Scene Preview
Scene: Figure_3
study:
HCP-D T1w/T2w Development
SCENE FILE:
Baum_hcpd_T1wT2w_development
SCENE:
Figure_3
DESCRIPTION:
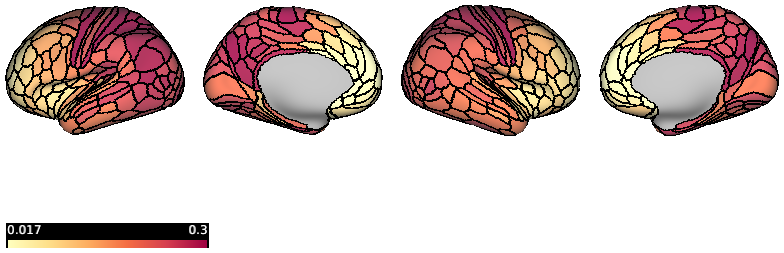
Figure 3.
Effect size estimates for regional Bayesian models of T1w/T2w development. Partial R2 values for age splines were estimated for each cortical parcel, representing the proportion of variance in T1w/T2w differences explained by age.
TAGS:
Species:Human