
Scene Preview
Scene: FigS6
study:
Neurite imaging reveals microstructural variations in human cerebral cortical gray matter.
SCENE FILE:
Figures_NODDI
SCENE:
FigS6
DESCRIPTION:
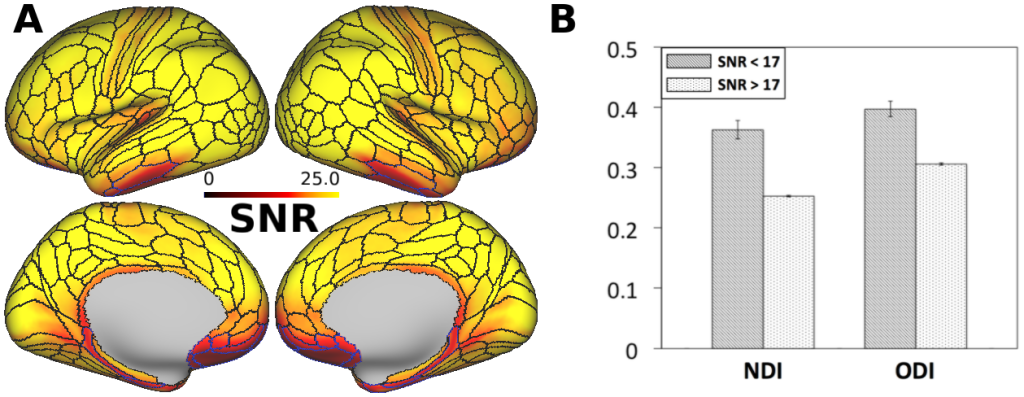
Signal-to-noise ratio (SNR), neurite density index (NDI) and orientation dispersion index (ODI). A) The SNR surface map is superimposed with the Human Connectome Project (HCP) parcellations. The blue borders indicate parcels where SNR is <17. B) The bar graph shows mean and standard error of NDI and ODI in each area of SNR<17 (n=29) and SNR>17 (n=331).
TAGS:
Registration:MSMAll, Surface Mesh:32k fs LR, Species:Human