
Scene Preview
study:
Development and Evolution of Cerebral and Cerebellar Cortex
SCENE FILE:
VanEssen_BBE2018
SCENE:
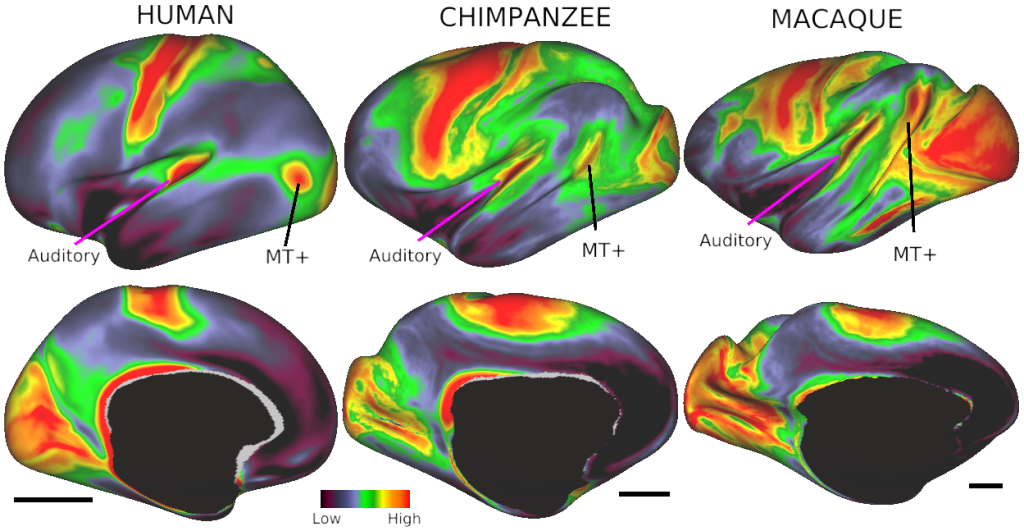
Figure 3. Myelin maps
DESCRIPTION:
Replaced on 11 Oct 2018 21:18:52
Commit: 79c9b54607ec46eed312116bb0ce0e008087802b
Medial wall colors corrected (black); Chimp medial wall corrected (was inadvertently macaque)
Group average cortical myelin maps from human, chimpanzee, and macaque. Black bars indicate relative scale of the group average inflated surfaces for each species. The “MT+” complex refers to heavily myelinated area MT plus the heavily myelinated portions of the neighboring MST complex, also implicated in motion processing.
TAGS:
Modality:Myelin Map, Surface Mesh:164k fs LR, Species:Chimpanzee, Registration:MSMAll, Species:Human, Species:Macaque, Atlas:Yerkes 19