
Scene Preview
Scene: Supplementary Figure 5
study:
Callosal fiber length scaling
SCENE FILE:
SupplymentaryResults
SCENE:
Supplementary Figure 5
DESCRIPTION:
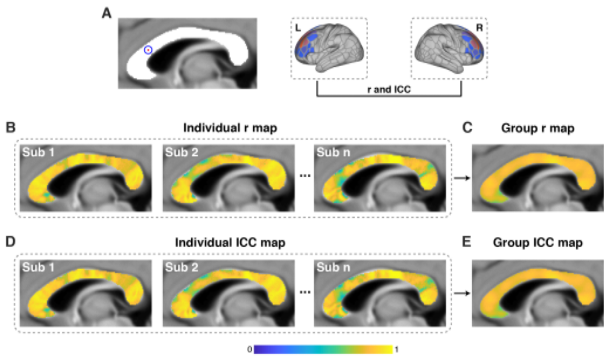
Supplementary Figure 5. Spatial similarity of passing streamline termination pattern between the two hemispheres. (A) Schematic diagram of calculating r and ICC of termination distribution between left and right hemispheres for one mCC voxel. Individual r map (B) and ICC map (D) of the mCC. Group r map (C) and ICC map (E) of the mCC.
TAGS:
Species:Human