
Scene Preview
study:
Dynamic Patterns of Cortical Expansion in Preterm Human Development
SCENE FILE:
DynamicPatternsHumanPretermExpansion
SCENE:
Figure5
DESCRIPTION:
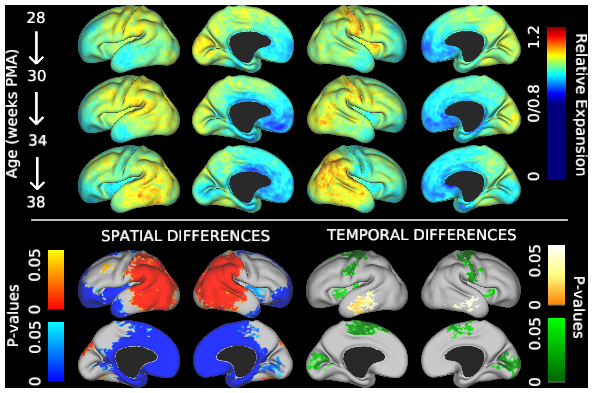
Fig. 5. Regions of highest cortical expansion change over time. (A) Maps of average relative expansion are shown for brief windows of development, denoted on left. For subjects in which three distinct periods of growth could be measured (n=4), regions of maximum expansion (white arrowheads) appear to shift over time. (B) Regions of statistically significant differences relative to global growth were observed based on 27 growth measurements (15 subjects) over the third trimester equivalent (temporal resolution <6 weeks, mean PMA=33 weeks). Left: Relative expansion is higher in the lateral parietal, temporal, occipital and frontal regions (red) and lower in the medial frontal and insular regions (blue). Right: Relative expansion in the early motor, sensory, and visual cortices, as well as in the insula, decreases over time (green). By contrast, relative expansion increases in the temporal lobe over time (yellow). Individual maps are also available for viewing within this scene file:
Relative expansion, left = covariateinteraction2.L.noivh.GGnorm.func.gii
Relative expansion, right = covariateinteraction2.R.noivh.GGnorm.func.gii
Midpoint PMAs corresponding to maps 1-27: 29 29 28 28.5 31.5 32 31 32 30.5 32 32 31 35.5 35 34.5 35 34.5 35 36 34.5 37.5 35 34.5 36 34.5 33 33
TAGS:
Species:Human