
Scene Preview
study:
Reliability and Stability Challenges in ABCD Task fMRI Data
SCENE FILE:
ABCD_Reliability_Activity_Change
SCENE:
Figure 2
DESCRIPTION:
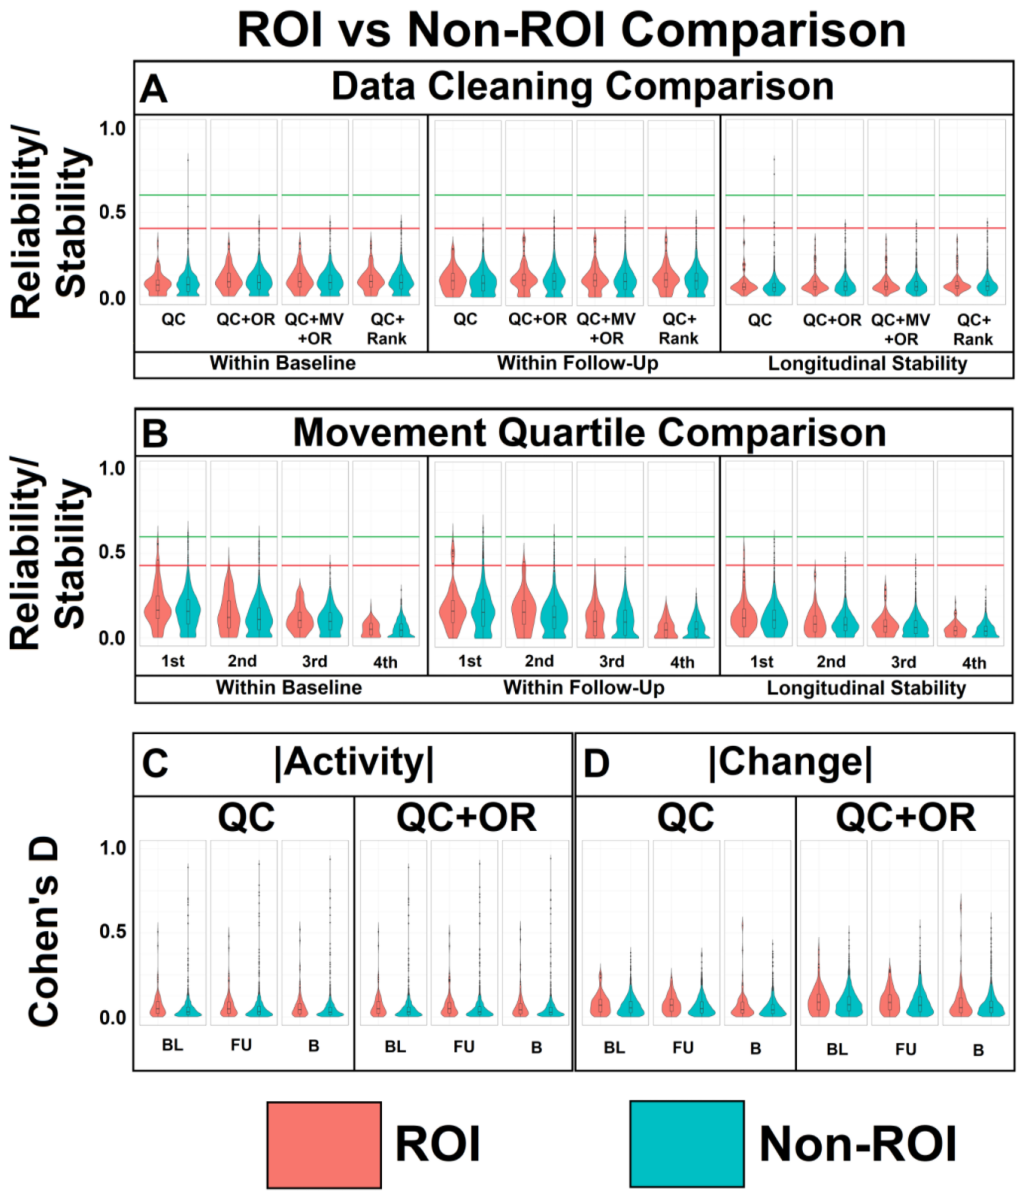
Violin plots with embedded box plots showing the distribution of reliability/stability (A and B), absolute values of activity (C), and absolute values of within- and between-session change (D) for a priori ROIs (red) and non-ROIs (blue). Data was cleaned using different data-cleaning approaches (A) and also separated into movement quartiles (B) to assess the impact of those factors on reliability and stability. QC: all data that passed ABCD’s quality control; QC+OR: QC dataset with outliers removed; QC+MV+OR: QC dataset with movement regressed and then outliers removed; QC+Rank: QC dataset with rank normalization. The movement quartiles analysis used the dataset with QC cleaning for the initial quartile separation and then had movement regressed out and outliers removed (separately for each quartile). Activity and change analyses are available only for the QC and QC+OR datasets as the movement regression and rank normalization processes demean the data, making meaningful between region comparisons impossible. For the embedded box plots, the horizontal dash indicates the median, with the box indicating the interquartile range (IQR, 25th to 75th percentile) and ‘outliers’ greater than 1.5 IQR from the median are shown with individual data points. ROI: Regions of Interest. Green line indicates the boundary for fair-good reliability/stability (0.6); red line indicates the boundary for poor-fair (0.4).
TAGS:
Modality:Task fMRI, Species:Human