
Scene Preview
Scene: Figure 4
study:
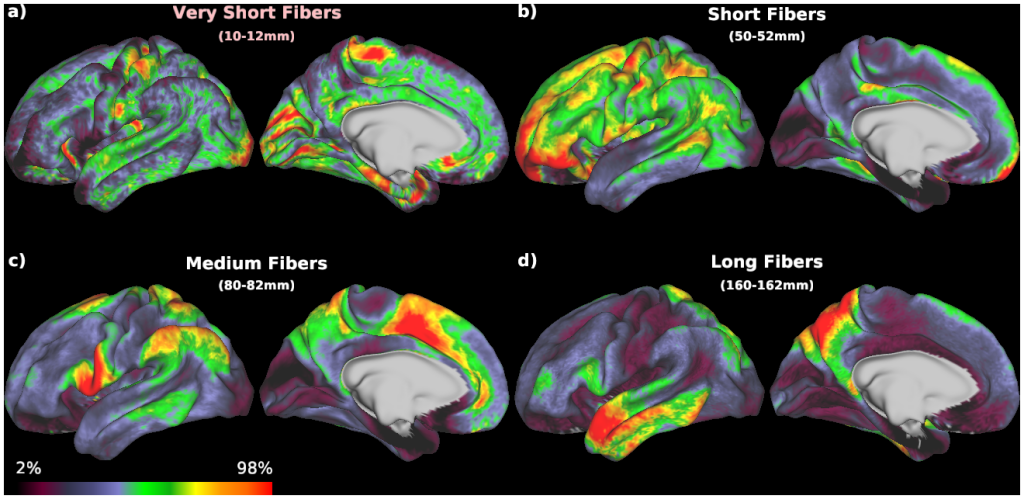
Fiber Length Profiling
SCENE FILE:
CTL-76
SCENE:
Figure 4
DESCRIPTION:
Exemplars of short, medium and long range fiber distributions in the left hemisphere. Red show the regions where there are relatively higher counts of streamlines with the specified length. The maximum and minimum values are truncated to the 2nd and 98th percentile. The values were truncated to reduce the possibility of having extreme maximum or minimum values biasing the results.
TAGS:
Species:Human