
Scene Preview
study:
Reliability and Stability Challenges in ABCD Task fMRI Data
SCENE FILE:
ABCD_Reliability_Activity_Change
SCENE:
Figure 4
DESCRIPTION:
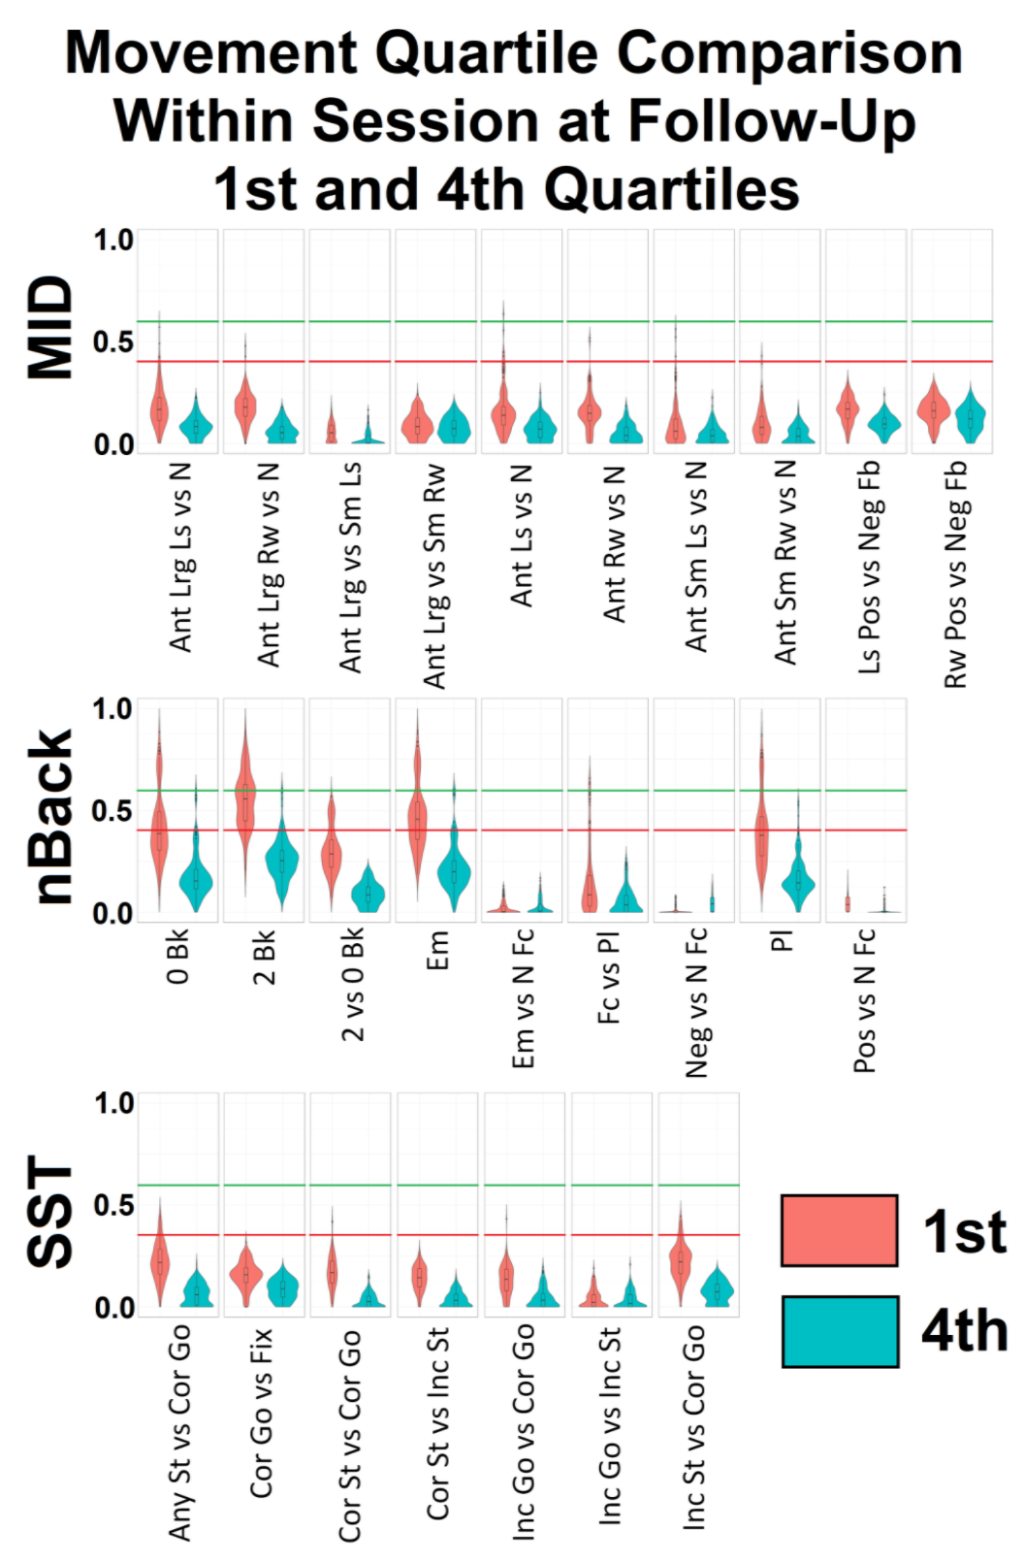
Violin plots with embedded box plots showing the distribution of task and contrast specific reliability within-session at follow-up for the 1st and 4th movement quartiles, using all regions from the whole brain analysis. The movement quartiles analysis used the dataset with QC cleaning for the initial quartile separation and then had movement regressed out and outliers removed (separately for each quartile). Violin plots for within-session at baseline and between session are available as Supplemental Figures S8 and S9. Green line indicates the boundary for fair-good reliability (0.6); red line indicates the boundary for poor-fair (0.4). MID: Monetary incentive delay task, nBack: Emotional nBack task, SST: Stop signal task. Ant: Anticipation, Bk: Back, Cor: Correct, Em: Emotion, Fb: Feedback, Fc: Face, Fix: Fixation, Inc: Incorrect, Lrg: Large, Ls: Loss, N: Neutral, Neg: Negative, Pl: Place, Pos: Positive, Rw: Reward, Sm: Small, St: Stop.
TAGS:
Modality:Task fMRI, Species:Human