
Scene Preview
study:
Cortical DTI and NODDI
SCENE FILE:
DTI_NODDI
SCENE:
Figure 2
DESCRIPTION:
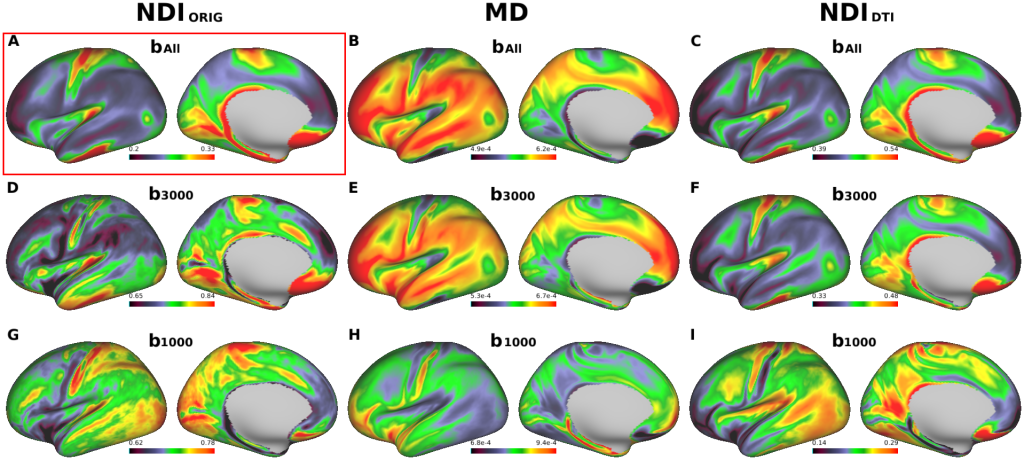
Figure 2. Cross-subject average cortical surface maps of neurite density index (NDI) and mean diffusivity (MD).
Cortical surfaces are different in terms of computation methods: original NODDI NDI (NDIORIG) (A, D, G), DTI-derived MD (B, E, H) and DTI-derived NODDI NDI (NDIDTI) (C, F, I) with different b-shell datasets used: all three b-values (bAll), only those of b=3000 (b3000) and b=1000 (b1000), respectively. A reference cortical surface maps of NDIORIG with bAll in (A) showed high values in primary sensorimotor, visual, auditory cortices as well as the middle temporal (MT) area, similar to the cortical myelin distribution as reported previously20. Both MD/bAll and MD/b3000 (B, E) showed inversed appearance to the reference, as well as both NDIDTI/bAll and NDIDTI/b3000 (C, F) showed very similar surface distribution to the reference. Note that NDIORIG/b3000 in (D) showed a different pattern from the reference and any computation methods using b1000 (G, H, I) did not show comparable pattern with the reference.
TAGS:
Surface Mesh:32k fs LR, Registration:MSMAll