
Scene Preview
study:
The Impact of Traditional Neuroimaging Methods on the Spatial Localization of Cortical Areas
SCENE FILE:
Coalson_et_al_2018_suppl
SCENE:
Supplemental Figure S3
DESCRIPTION:
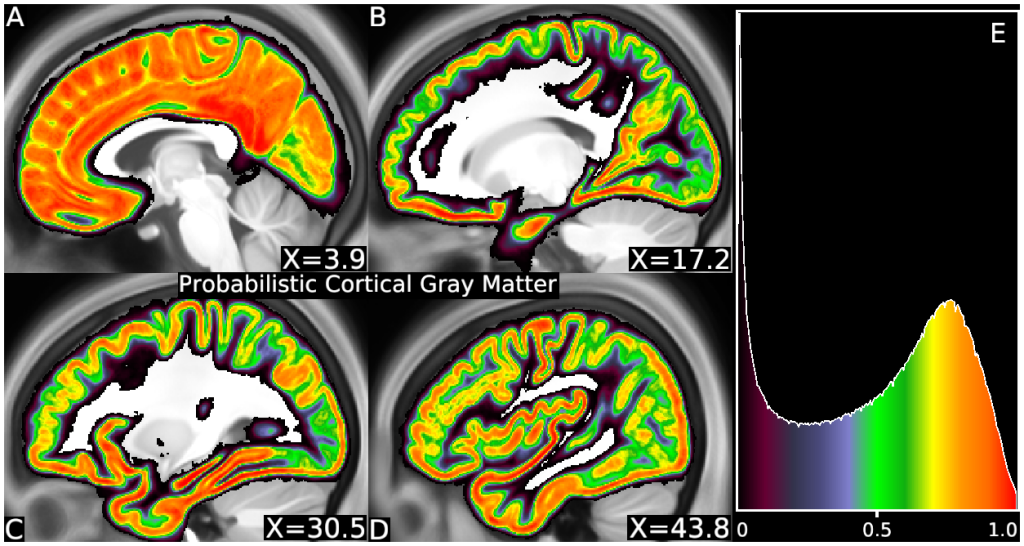
Panels A – D show the probabilistic map of cortical gray matter, using the partial-volume method at 0.7 mm, in four parasagittal slices through the 210V average T1w volume. In many regions a clear red/orange ribbon is evident, indicating locations where alignment of the cortical grey matter ribbon is reasonably high (gray-matter probability > 0.8). These regions include most of the cortex along the medial aspect of the hemisphere (panel A), plus the insula, orbitofrontal and anterior and inferior temporal cortex, and the central sulcus. More laterally (panels B through D), many sulcal regions and some gyral regions have only modest cortical gray matter probabilities (0.5 - 0.7; green, yellow), particularly over much of prefrontal and parietal cortex. These lower probabilities indicate extensive residual mixing of tissue classes across subjects that were not well aligned by volume-based registration. Panel E shows a histogram of the probabilities across the whole volume. The average probability of cortex where cortex is more probable than other classes is 0.730. In contrast, when data is analyzed on the surface using ribbon mapping, the only tissue mixing effects are from partial volume effects due to the acquisition resolution or surface placement problems, as each subject’s surfaces are used to extract cortical signal from each subject’s own volume files and the comparable value is 0.92 (for 0.7 mm resolution data). See Supplemental Methods Sections M2 and M5.
TAGS:
Modality:T1-weighted