
Scene Preview
study:
Mapping the human corticoreticular pathway
SCENE FILE:
Figures
SCENE:
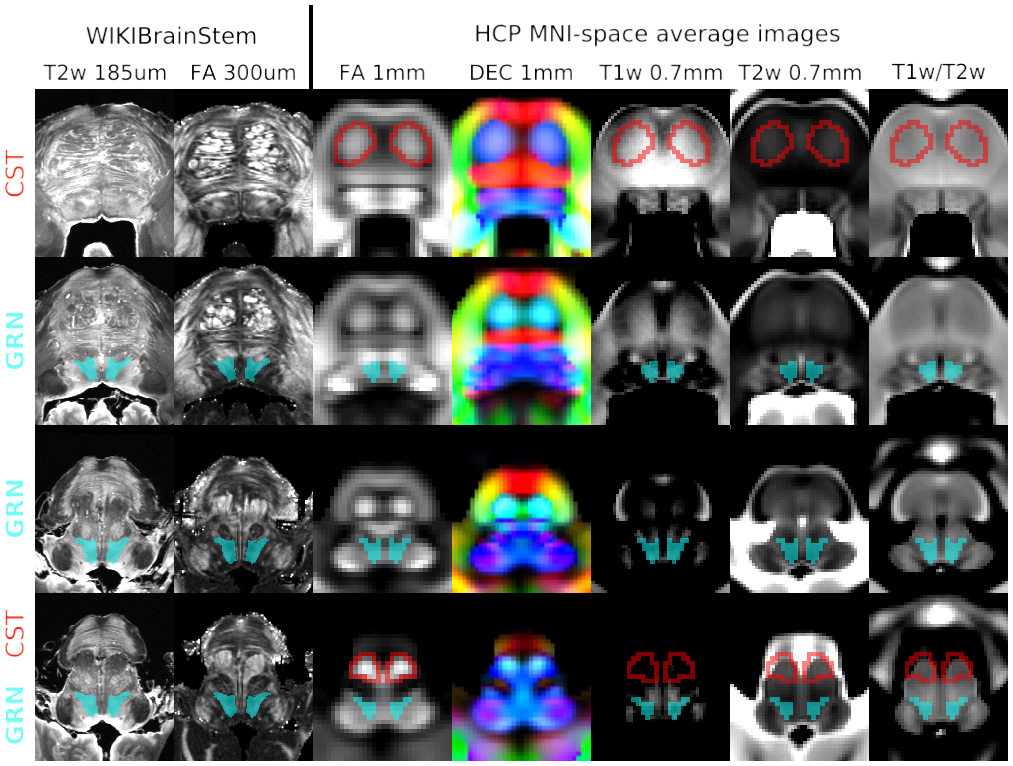
Figure 1. Delineation of the gigantocellular reticular nucleus (GRN) and corticospinal tract (CST) waypoints
DESCRIPTION:
The left two columns show the WIKIBrainStem ultra-high resolution 11.7T MRI contrasts and GRN annotation on a post-mortem brainstem,(Lechanoine, et al. 2021) after rigid rotation to the approximate orientation of the MNI template brainstem. The right columns show Human Connectome Project (HCP) high resolution 3T MRI contrasts averaged across 1,065 participants (FA, DEC) or 1,096 participants (T1w, T2w and T1w/T2w) after nonlinear alignment to the MNI template brain.(Glasser, et al. 2013) Each row shows approximately the same axial slice across all images (row 1, z = -32 mm in MNI space; row 2, z = -40 mm; row 3, z = -45 mm; row 4, z = -49 mm). Image intensity scaling was set to maximize the relevant contrast boundaries. We manually traced the GRN label (shown in translucent light blue) and the CST waypoints (outlined in red) on the HCP MNI-space average images. For clarity, labels are not shown on the DEC image. FA, fractional anisotropy; DEC, direction-encoded color.
TAGS:
Species:Human