
Scene Preview
study:
Test-retest reliability of fMRI
SCENE FILE:
TrT_Suppl_v7
SCENE:
Suppl_Fig3
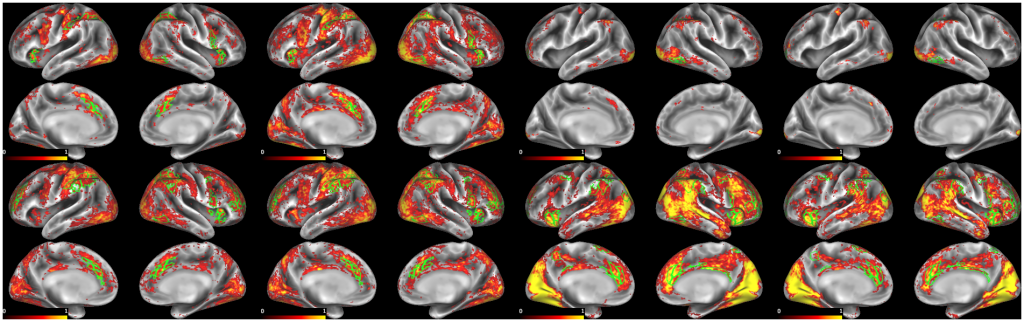
DESCRIPTION:
Figure S3. Cortical regions with significant brain activation in the categorical design at Time 1 and Time2 related to the decision making and outcome phases (feedback) of the BART. The color scale indicates Cohen’s d (mean across participants of the activation beta weight divided by the standard deviation across participants of the beta weight) for individual cortical grayordinates masked by the grayordinate-wise FDR-corrected map of statistically significant activation (computed via permutation testing using the PALM toolbox). Green outlines display the MMP parcels that are selected for further analysis based on our combined criteria of effect size, spatial overlap with activation and previous reports (thresholded subset).
TAGS:
Surface Mesh:32k fs LR, Modality:T2-weighted, Modality:T1-weighted, Parcellation:HCP_MMP1.0, Species:Human, Atlas:HCP-S1200, Modality:Task fMRI