
Scene Preview
study:
The Impact of Traditional Neuroimaging Methods on the Spatial Localization of Cortical Areas
SCENE FILE:
Coalson_et_al_2018_suppl
SCENE:
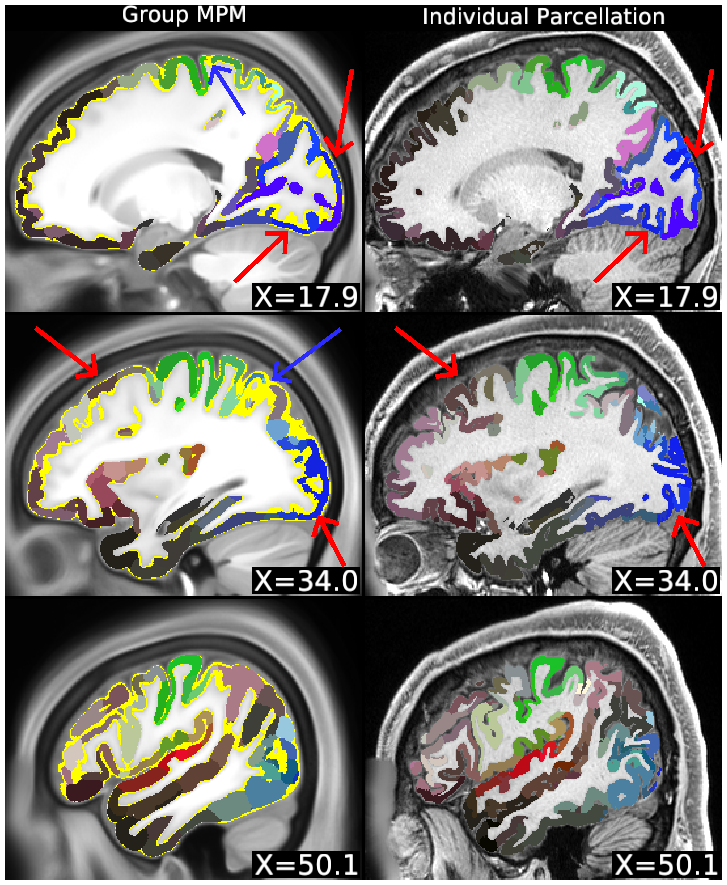
Supplemental Figure S4
DESCRIPTION:
Comparison of a volume-based group MPM (left) to an individual subject’s areal parcellation displayed in the volume (right). The volumetric areal MPM (vMPM) on the left is displayed on representative parasagittal slices from the group average T1w volume and overlaid on voxels where cortex is the most likely tissue class (yellow underlay). Individual areas are colored according to function-related hues [cf. Figure 3, (1)]. In regions where the probabilistic gray matter ribbon has relatively high values (red/orange in Figure S3) and low areal uncertainties (blue/indigo in Figure S2), the vMPM forms a thick continuous ribbon that is roughly comparable to average cortical thickness in these regions. The MPM shows where each area is more likely than any other area or tissue class. Blue arrows (and yellow showing through) point to breaks in the vMPM ribbon, where no cortical area has high enough probability to overcome the white matter and CSF probabilities, due to the combination of tissue and areal misalignment in the volume. Also note that the ribbon is thinner in some areas, for similar reasons. The right panels show an individual subject parcellation mapped to the volume (subject ID 121618), displayed on the individual’s T1w volume and the individual’s cortical ribbon (not visible because of perfect overlap). Red arrows point to exemplar individual cortical folding details that do not match the group vMPM. See Supplemental Methods Section M6.
TAGS:
Modality:T1-weighted