
Scene Preview
study:
Callosal fiber length scaling
SCENE FILE:
MainText
SCENE:
Fig. 7
DESCRIPTION:
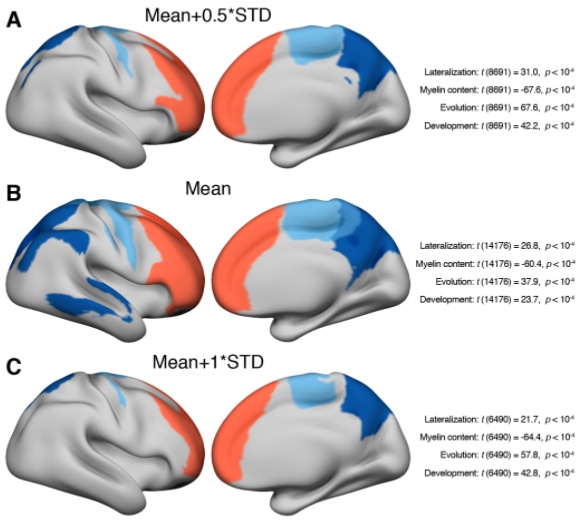
Fig. 7. Cortical topography of the mCC clusters showing fiber length over-scaling and under-scaling. As shown in Fig. 6, there is one over-scaling mCC cluster (red) and there are two under-scaling mCC clusters (blue). To extract the binary cortical topography map, a threshold was applied to the group streamline count surface map. (A) The main threshold was defined as the mean + 0.5*STD of the group streamline count value across the entire surface (i.e., Fig. 6C). (B) The threshold was calculated as the mean of the group streamline count value across the entire surface. (C) The threshold was defined as the mean + 1*STD of the group streamline count value across the entire surface. Under each threshold, the differences between the over-scaling and under-scaling clusters of the functional lateralization index, of cortical myelin content, of evolutionary cortical expansion and of developmental cortical expansion are listed on the right side. The comparison showed consistent statistical results with our main text, indicating a limited impact of the cortical mapping threshold on the results.
TAGS:
Species:Human