
Scene Preview
study:
The Impact of Traditional Neuroimaging Methods on the Spatial Localization of Cortical Areas
SCENE FILE:
Coalson_et_al_2018_suppl
SCENE:
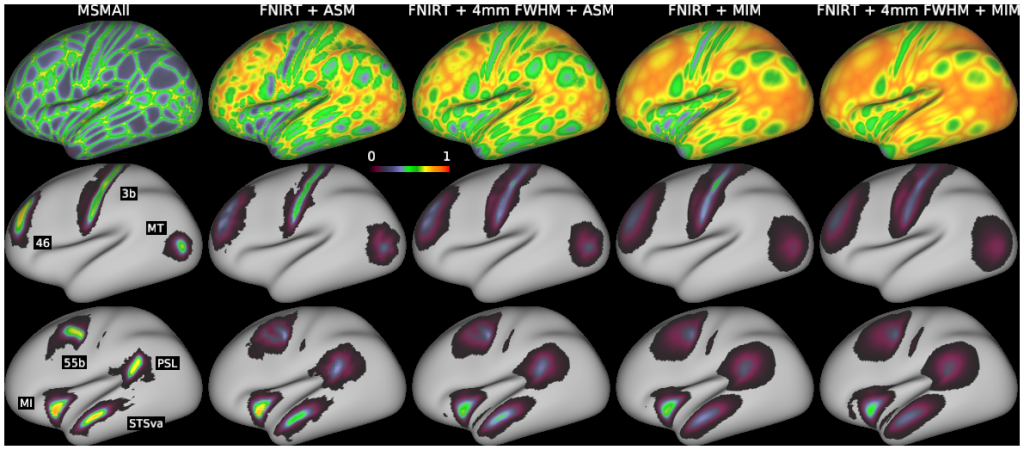
Supplemental Figure S10
DESCRIPTION:
Comparison of surface-based analysis to average surface mapping (ASM), and multi-individual mapping (MIM) with and without 4 mm of volume-based smoothing. We took the per-area group partial voxel volumes at 2 mm, and put them through representative processing and visualization pipelines. Top row: maps of “leftover signal fraction” (one minus the largest value of the area signal fractions: if a vertex has 0.8 of its signal come from within area V1, its leftover fraction is 0.2), which is similar to the uncertainty measure: higher values mean there is more signal mixing across areas and across tissue types. Middle and bottom rows: simulated signal of areas 3b, 46, and MT (middle) and 55b, PSL, MI, and STSva (bottom) for each processing and visualization method. Left column: Individual subject area signal volumes were mapped to each individual’s surfaces, followed by averaging using MSMAll registration. Left middle column: Area signal volumes were averaged using FNIRT registration, then mapped to the group average surfaces (see “Average Surface Mapping” in Fig. 9). Middle column: Same as left middle column, but with 4mm FWHM volume smoothing applied before mapping to the surface. Right middle column: The same group-average volumes were mapped to many individual surfaces and then averaged using MSMAll registration (see “Multi-Individual Mapping” in Fig. 9). Right column: Same as the right middle column, but 4mm FWHM volume smoothing was applied. See Supplemental Methods Sections M2 and M9.
TAGS:
Surface Mesh:32k fs LR, Registration:MSMAll