
Scene Preview
Scene: Figure_2
study:
HCP-D T1w/T2w Development
SCENE FILE:
Baum_hcpd_T1wT2w_development
SCENE:
Figure_2
DESCRIPTION:
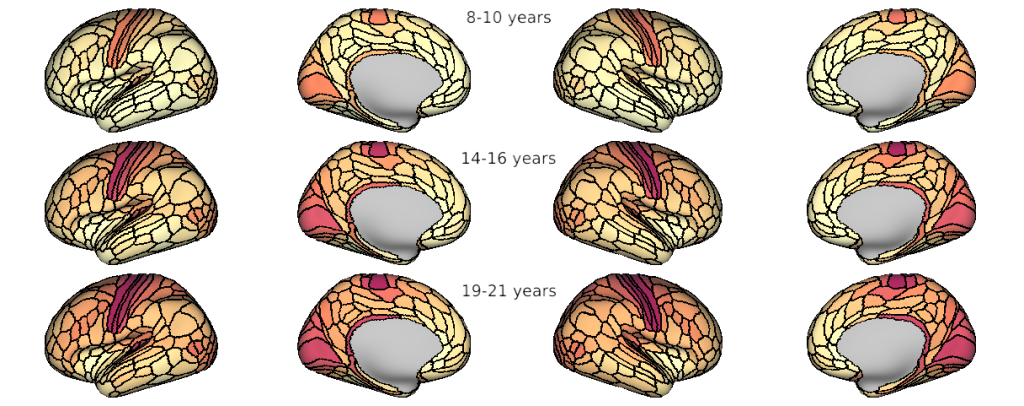
Figure 2.
Parcellated T1w/T2w maps were averaged across participants within three age groups to illustrate the spatial patterning of age-related increases in T1w/T2w during youth. T1w/T2w units of 1.4 and 1.9 correspond to the 2nd and 98th percentiles in this dataset. Age groups include 8-10 year olds (n=145), 14-16 year olds (n=154), and 19-21 year olds (n=120). Age-related increases in cortical T1w/T2w were observed across the cortical sheet, reinforcing a sensorimotor-association hierarchy in cortical microstructure.
TAGS:
Species:Human