
Scene Preview
Scene: Gene expression maps and surrogate maps
study:
Transcriptomics-informed modeling of pharmacological neuroimaging effects of LSD
SCENE FILE:
Burt_2021_LSD
SCENE:
Gene expression maps and surrogate maps
DESCRIPTION:
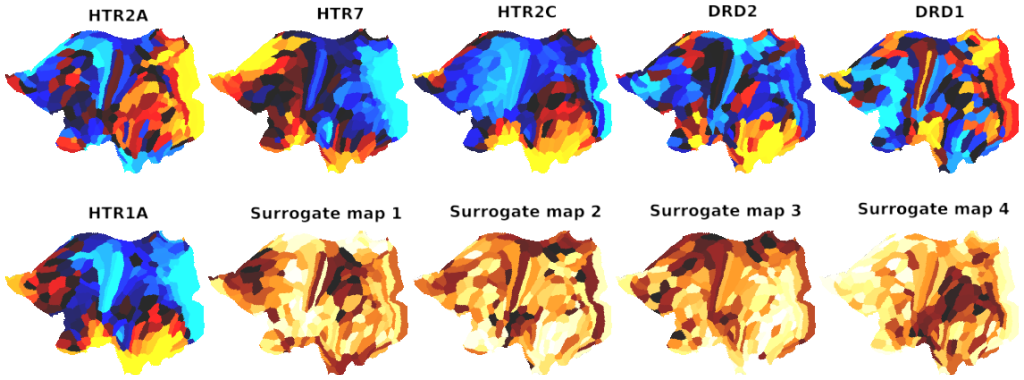
Gene expression maps analyzed in Figure 3, including the HTR2A map that is used throughout the study. Also included are the four spatial autocorrelation-preserving surrogate maps illustrated in Figure 3C.
TAGS:
Other Data:Gene, Species:Human, Parcellation:HCP_MMP1.0