
Scene Preview
study:
The Impact of Traditional Neuroimaging Methods on the Spatial Localization of Cortical Areas
SCENE FILE:
Coalson_et_al_2018_suppl
SCENE:
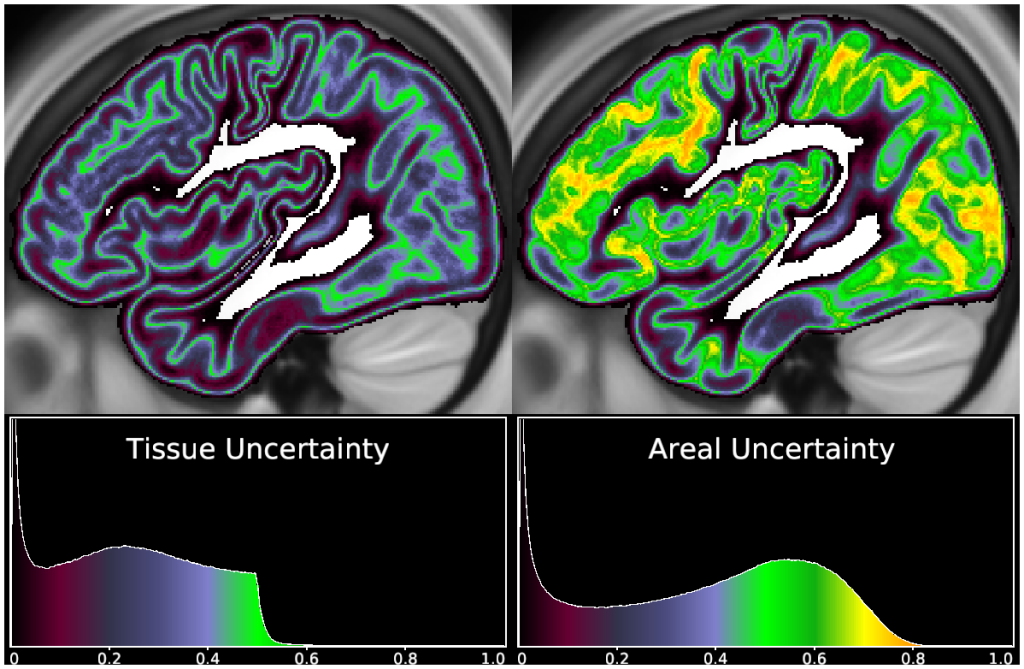
Supplemental Figure S2
DESCRIPTION:
This figure shows a comparison between tissue uncertainty (left) and areal uncertainty (right) in the volume for corresponding single volume slices (top) and overall histograms (bottom). Uncertainty is computed as one minus the maximum probability across the relevant classifications (tissue types, or areas and non-cortical tissues). Along most of the cortical gray matter ribbon, areal uncertainty is much higher (green, yellow in right column) than the tissue class uncertainty (blue, indigo in left column). This reflects the additional difficulty that volume-based registration has in aligning cortical areas above and beyond the difficulty it has in aligning cortical grey matter. Locations classified as cortex among tissue types may nonetheless be classified as a noncortical class when computing areal uncertainty, if the areal probabilities are split between multiple areas (see Main Text Figure 4). In these locations, choosing a cortical area (by ignoring the probabilities of “outside pial” and “inside white”) would cause this uncertainty measure to be even higher. See Supplemental Methods Sections M2 and M8.
TAGS:
Modality:T1-weighted