
Scene Preview
study:
Notes on fiber length measurements
SCENE FILE:
CTL-76
SCENE:
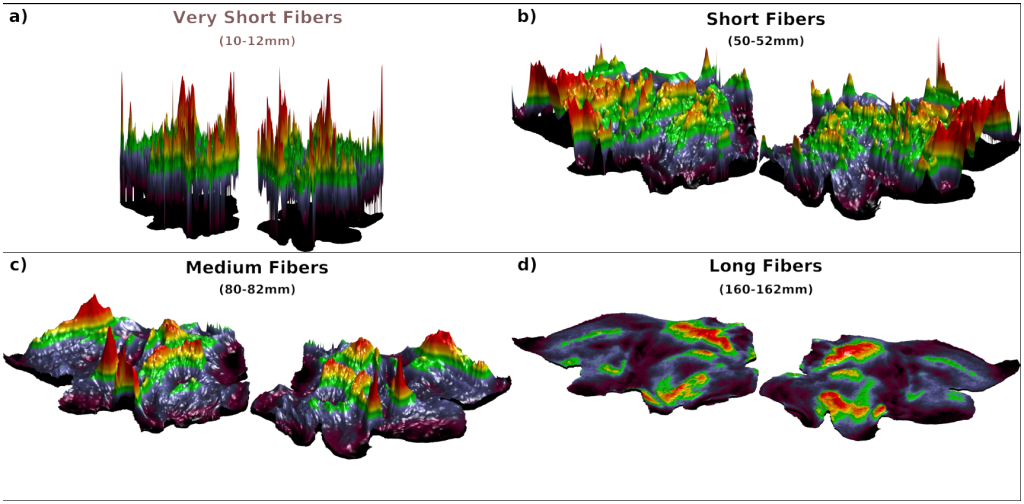
Figure 5
DESCRIPTION:
Exemplars of short, medium and long range fiber distributions in both hemispheres plotted on flat maps with the z dimension representing the streamline count. One notes that the short range fibers are all above the baseline (black flatmap visible under the short range image), the medium range fibers include regions (in red) that rise well above baseline, in the long range fibers, even the regions with the highest fiber count are barely above baseline (zero fibers). The same colormaps and color ranges were used as in figure 4.
Note that these images are not designed to elucidate anatomy, this can be done with ease in figure 4. This figure provides a way to visualise the actual CTL values across different lengths.
TAGS:
Species:Human, Connectivity:Tractography