
Scene Preview
study:
Reliability and Stability Challenges in ABCD Task fMRI Data
SCENE FILE:
ABCD_Reliability_Activity_Change
SCENE:
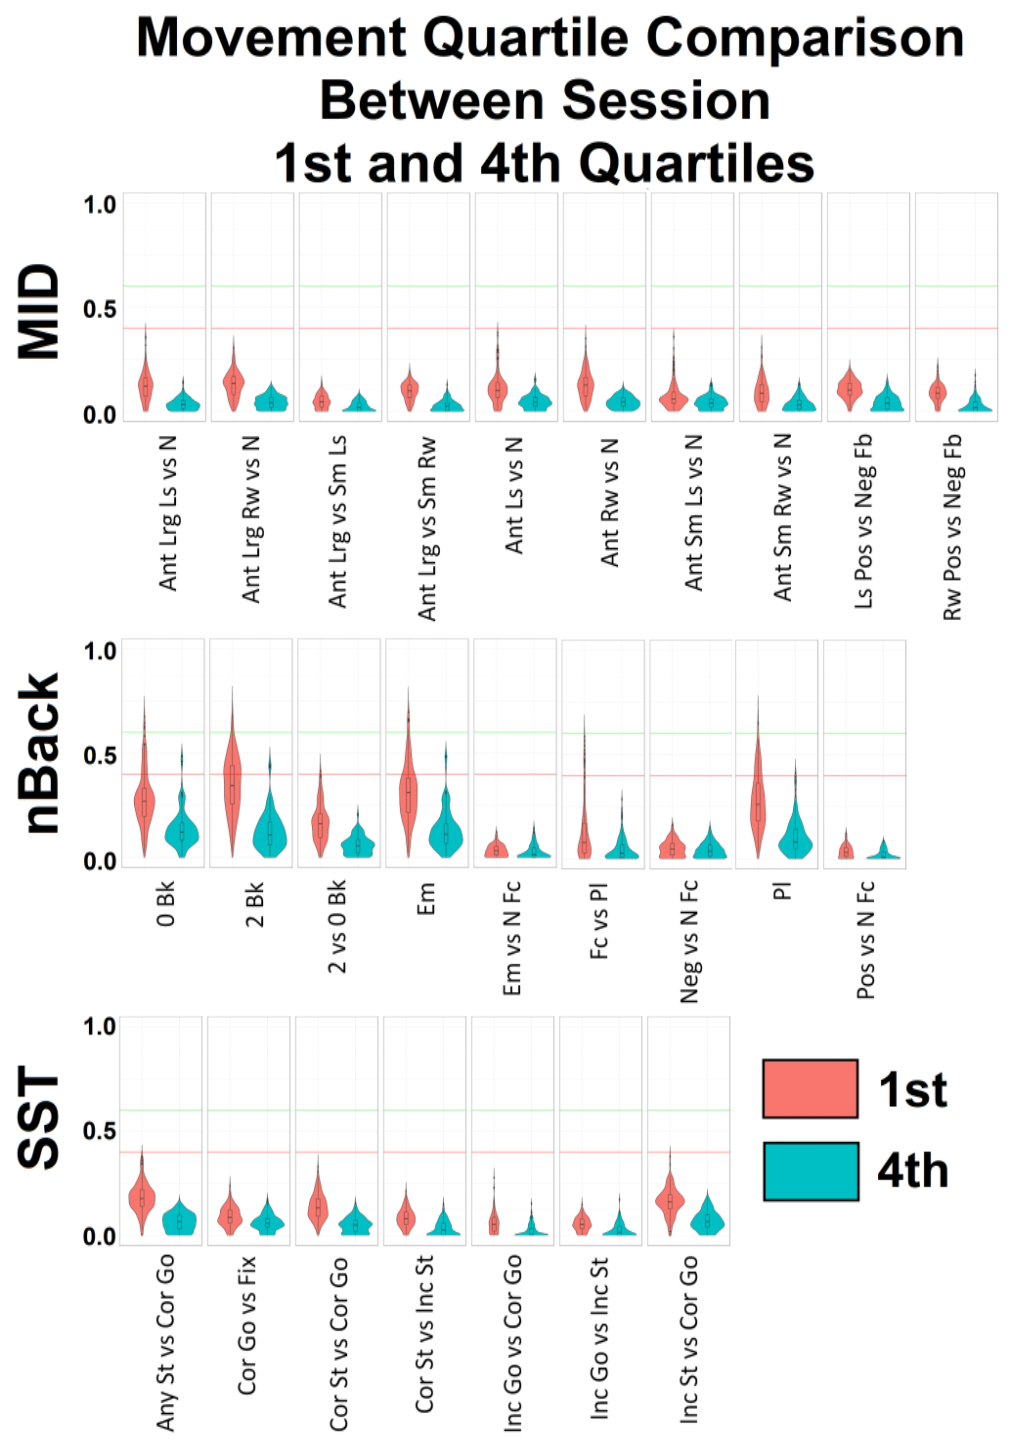
Supplemental Figure 9
DESCRIPTION:
Violin plots for task and contrast specific stability for the 1st and 4th movement quartiles, using all regions from the whole brain analysis. Box plot shown indicating median and quartiles for stability estimates, dots indicate outliers. Green line at the fair-good boundary of .6, red line at the poor-fair boundary of .4. MID: Monetary incentive delay task, nBack: Emotional nBack task, SST: Stop signal task. Bars: 1 standard deviation. Ant: Anticipation, Bk: Back, Cor: Correct, Em: Emotion, Fb: Feedback, Fc: Face, Fix: Fixation, Inc: Incorrect, Lrg: Large, Ls: Loss, N: Neutral, Neg: Negative, Pl: Place, Pos: Positive, Rw: Reward, Sm: Small, St: Stop.
TAGS:
Modality:Task fMRI, Species:Human