
Scene Preview
Scene: Supplementary Figure 6
study:
Callosal fiber length scaling
SCENE FILE:
SupplymentaryResults
SCENE:
Supplementary Figure 6
DESCRIPTION:
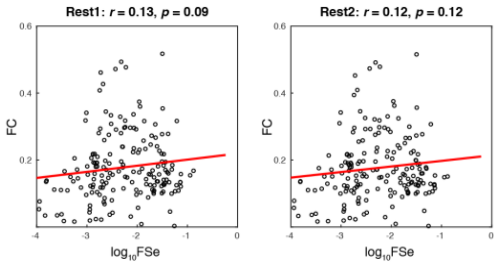
Supplementary Figure 6. Correlation between structural connectivity and functional connectivity. Scatter plots of structural connectivity (FSe) and resting-state functional connectivity (rs-FC, Pearson correlation) across the 180 HCPMMP homotopic regional pairs. Left: Rest1; Right: Rest2.
TAGS:
Species:Human