
Scene Preview
study:
HCP-D T1w/T2w Development
SCENE FILE:
Baum_hcpd_T1wT2w_development
SCENE:
Figure_5
DESCRIPTION:
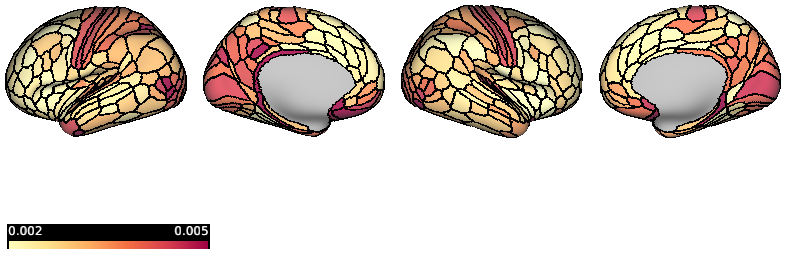
Figure 5.
The nonlinearity of age-related changes in T1w/T2w was estimated for each cortical parcel using the mean absolute posterior second derivative, where higher values indicate more nonlinear growth. Sensorimotor areas such as the left V2 (highlighted in panel A, left) had relatively nonlinear T1w/T2w growth, with the rate of change decreasing credibly by 17.5 years old (indicated by yellow segment). Cortical parcels in heteromodal and paralimbic association areas such as the right anterior ventral insula (highlighted in panel A, right) had relatively linear growth in T1w/T2w (constant slope).
TAGS:
Species:Human