
Scene Preview
Scene: Figure_4
study:
HCP-D T1w/T2w Development
SCENE FILE:
Baum_hcpd_T1wT2w_development
SCENE:
Figure_4
DESCRIPTION:
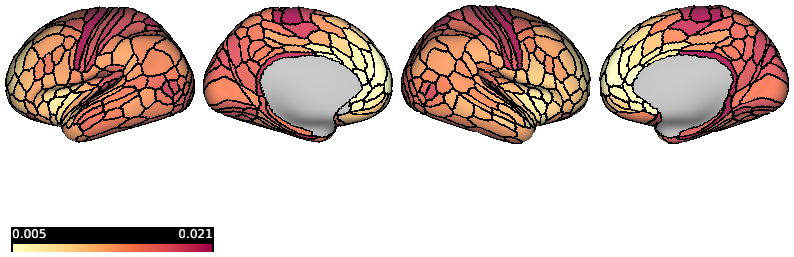
Figure 4.
Annualized rate of change (AROC) in T1w/T2w was estimated for each cortical parcel. The AROC was relatively high in sensorimotor areas such as the right primary motor cortex (area 4; highlighted in panel A, right). In contrast, the AROC in T1w/T2w was relatively low in prefrontal and paralimbic association areas such as the left medial prefrontal cortex (area 9m; highlighted in panel A, left).
TAGS:
Species:Human