
Scene Preview
study:
A Multi-modal Parcellation of Human Cerebral Cortex
SCENE FILE:
Glasser_et_al_2016_HCP_MMP1.0_1_MainText
SCENE:
Figure 5
DESCRIPTION:
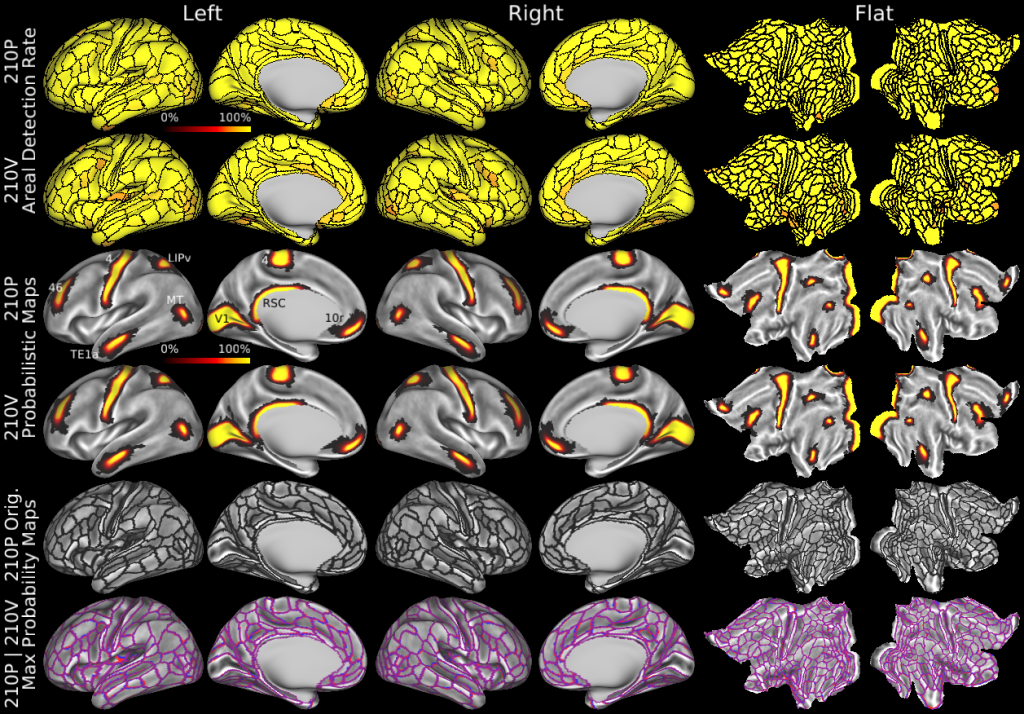
Areal detection rates, probabilistic areas, and parcellation reproducibility. Rows 1 (210P) and 2 (210V) show the individual subject areal detection rates (see Methods section on cortical areal classifier) as parcellated maps. Most areas are yellow (100%), and the minimum detection rate across both rows was 73%. Rows 3 and 4 illustrate probabilistic maps of areas V1, M1, RSC, MT, LIPv, TE1a, 46, and 10r for the 210P (row 3) and 210V (row 4) groups. Row 5 shows the original parcellation derived from the semi-automated neuroanatomical approach. Row 6 shows the group MPM maps from 210P (blue), 210V (red), and their overlap (purple).
TAGS:
Surface Mesh:32k fs LR, Registration:MSMAll, Species:Human, Modality:T1-weighted, Modality:T2-weighted, Modality:Myelin Map