
Scene Preview
study:
A Multi-modal Parcellation of Human Cerebral Cortex
SCENE FILE:
Glasser_et_al_2016_HCP_MMP1.0_2_SupplementaryResultsAndDiscussion
SCENE:
Figure 1
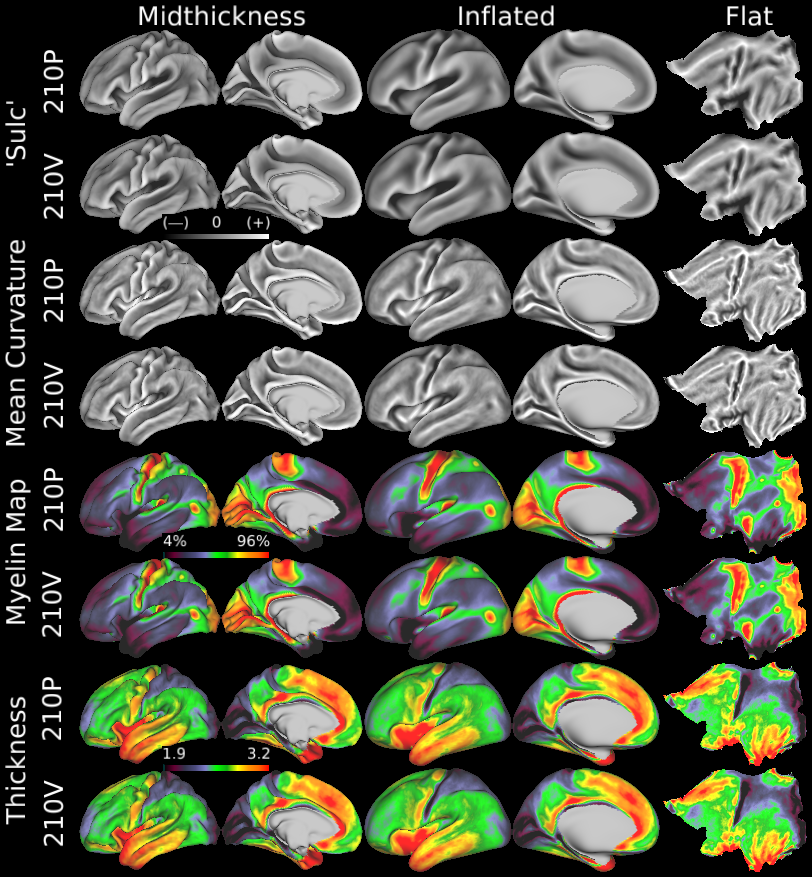
DESCRIPTION:
HCP group average architectural and folding map reproducibility. Here we show group average left midthickness surfaces in Columns 1 and 2, left inflated surfaces in Columns 3 and 4 and left flat maps in Column 5. The 210P group averages are the odd rows and the 210V group averages are the even rows. The top two rows are FreeSurfer 'sulc' (r=0.996), the next two are FreeSurfer 'curv' (r=0.979), the next two are myelin (r=0.998), and the final two are thickness corrected for folding effects (r=0.994); all show extremely high cross-group reproducibility (both hemispheres were used in computing spatial map correlation coefficents). Folding patterns (sulc and curv) become blurry in many higher association regions of cortex, though they remain sharp in primary regions such as the central sulcus, calcarine sulcus, and insula, indicating that these regions have cortical areas that are well correlated with folding patterns. Areal feature-based surface registration also preserves fine spatial details in myelin maps and thickness maps that are consistent across groups. An example is the reproducible variation in the myelin maps of the primary somatosensory cortex, which appears to be related to somatotopic subdivisions (see Supplementary Neuroanatomical Results #6, where these variations are compared with functional and connectivity-based somatotopic subdivisions). Sulcal folding is dark and gyral folding is bright, with grey in between. High myelin and thick cortex are red, low myelin and thin cortex are dark. T1w/T2w myelin content maps are a relative measure depicted on a percentile scale that indicates which cortical areas have more or less myelin. For brevity, we refer to them as 'myelin maps' in this report (as in previous reports). We consider them akin to an in vivo, MRI-based "myelin stain," analogous to histological myelin stains long used neuroanatomists rather than a truly quantitative measure of intracortical myelin (Glasser et al., 2014; Glasser and Van Essen, 2011).
TAGS:
Surface Mesh:32k fs LR, Registration:MSMAll, Species:Human, Modality:Myelin Map, Modality:T1-weighted, Modality:T2-weighted