
Scene Preview
study:
A Multi-modal Parcellation of Human Cerebral Cortex
SCENE FILE:
Glasser_et_al_2016_HCP_MMP1.0_3_SupplementaryMethods
SCENE:
Figure 8
DESCRIPTION:
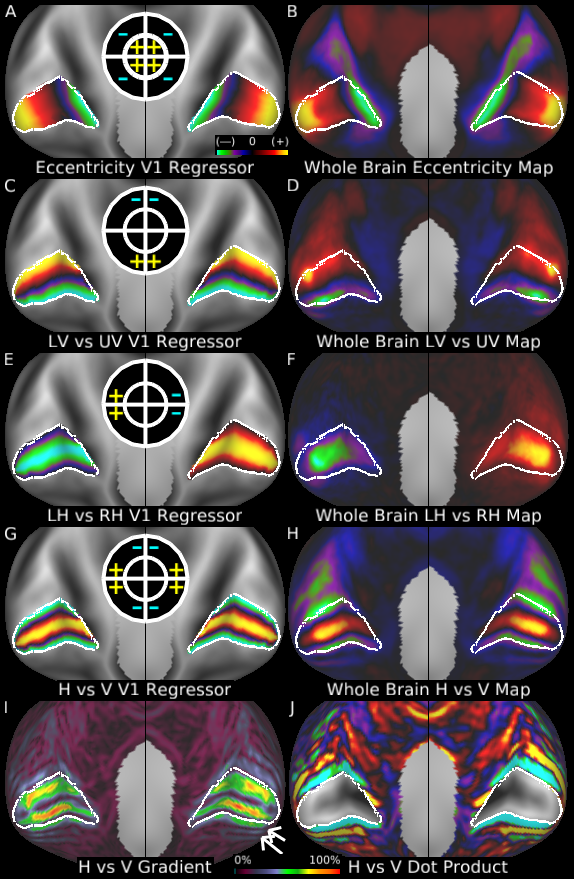
Figure 8 shows the V1-constrained spatial regressors and their corresponding whole brain spatial maps (along with icons representing the portions of the visual field being contrasted). Panels A and B show the foveal vs peripheral contrast. Panels C and D show the upper vs lower vertical meridian contrast. Panels E and F show the left vs right horizontal meridian contrast. Panels G and H show the horizontal vs vertical meridian contrast, which is the most useful for visual area parcellation. Panel I shows the gradient magnitude of Panel H, where local gradient minima represent the locations of polar angle reversal. Panel J shows the dot product of the gradient vector of Panel H with a reference vector that points towards V1. The early visual areas alternate between positive and negative with the zero point lying on their borders (this measure is undefined inside of V1, see #6.5).
TAGS:
Surface Mesh:32k fs LR, Registration:MSMAll, Species:Human, Modality:T1-weighted, Modality:T2-weighted, Modality:Myelin Map