
Scene Preview
study:
The Human Connectome Project’s neuroimaging approach
SCENE FILE:
Glasser_et_al_2016_Neuroimaging_HCP_Style_Primer_SI
SCENE:
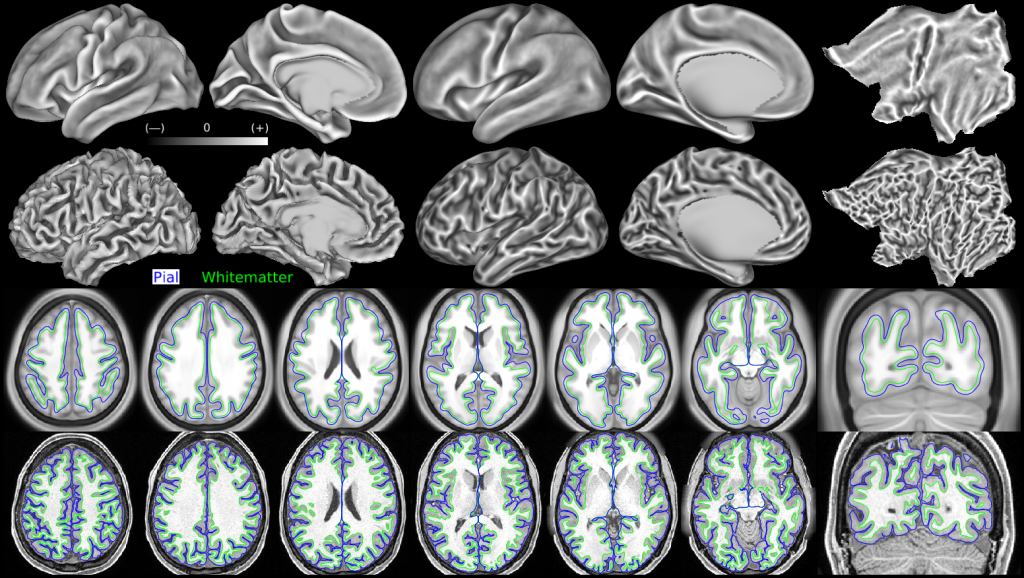
Figure 12
DESCRIPTION:
Effects of averaging surface coordinates and folding maps after areal feature-based registration (MSMAll). The first row shows the group average midthickness surface (left), and the group average curvature map also displayed on inflated and flat surfaces (center and right). The group consisted of 210 subjects. The second row shows an individual subject's midthickness surface (left), and the individual's curvature map displayed also on inflated and flat surfaces (center and right). Note how much less detailed the group average surfaces and curvature maps are in most regions of cortex. However, in regions with consistent folding patterns across subjects and consistent relationships between cortical areas and folds, the group average patterns remain sharp (e.g. the central and calcarine sulci and the insula). The third row shows the group average T1w volume (after FNIRT nonlinear volume registration to MNI152 space of each subject in the group) together with the group average white (green) and pial (blue) surface contours. The fourth row shows the same individual subject's T1w volume together with the individual's white and pial surfaces (after aligning both the T1w volume and the surfaces to the group average in MNI space using FNIRT nonlinear volume registration). Despite the high precision of the white and pial surfaces in following the grey matter ribbon in the individual, the group average surfaces do not follow the group average volume particularly well, except in the regions where there are consistent folding patterns across subjects and consistent relationships between cortical areas and folds (as mentioned above). These issues also occur with folding-based surface registration (not shown), though they are less severe, because for folding-based registration the dominant factor is inconsistency in folding patterns across subjects (as no attempt is made to directly align cortical areas). The midthickness surfaces are the average of the white and pial surfaces (this average is performed on each individual, and the group midthickness surface is the average of the individual midthickness surfaces).
TAGS:
Surface Mesh:32k fs LR, Registration:MSMAll, Species:Human, Modality:Myelin Map, Modality:T1-weighted, Modality:T2-weighted