
Scene Preview
study:
The Human Connectome Project’s neuroimaging approach
SCENE FILE:
Glasser_et_al_2016_Neuroimaging_HCP_Style_Primer_SI
SCENE:
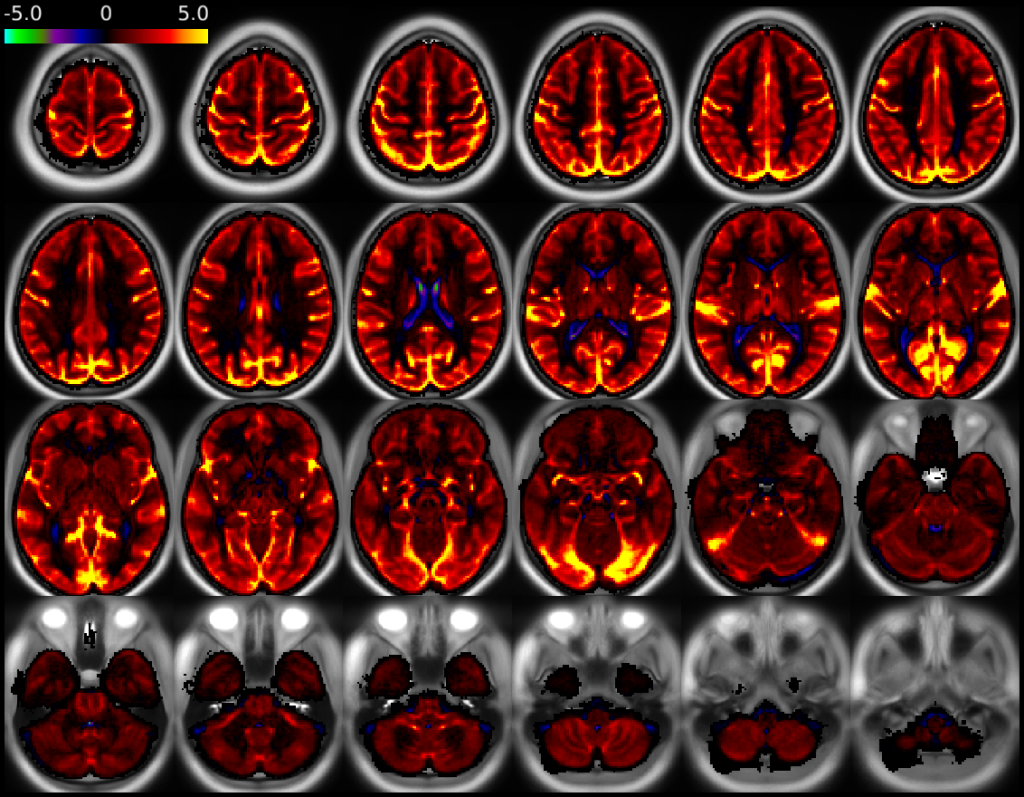
Figure 5
DESCRIPTION:
Beta map of the mean fMRI timeseries. The timecourses were averaged over the whole brain (including gray matter, white matter, and CSF), regressed into the data of each subject, and then averaged across (n = 210 HCP subjects). One particularly striking characteristic of this map is how tissue-specific the global signal is (after ICA+FIX data cleanup), being generally most positive in grey matter, close to zero in white matter, and slightly negative in the ventricles. The tissue specificity of this signal argues against a non-physiologic, non-BOLD contrast-based cause of the signal (e.g., direct biophysical effects of subject head motion). This map by itself does not tell us to what extent the global signal is physiological noise vs. neural signal. Although the data are averaged in the volume across subjects, they still appear relatively sharp because they are not smoothed.
TAGS:
Surface Mesh:32k fs LR, Registration:MSMAll, Species:Human, Modality:Myelin Map, Modality:T2-weighted, Modality:T1-weighted